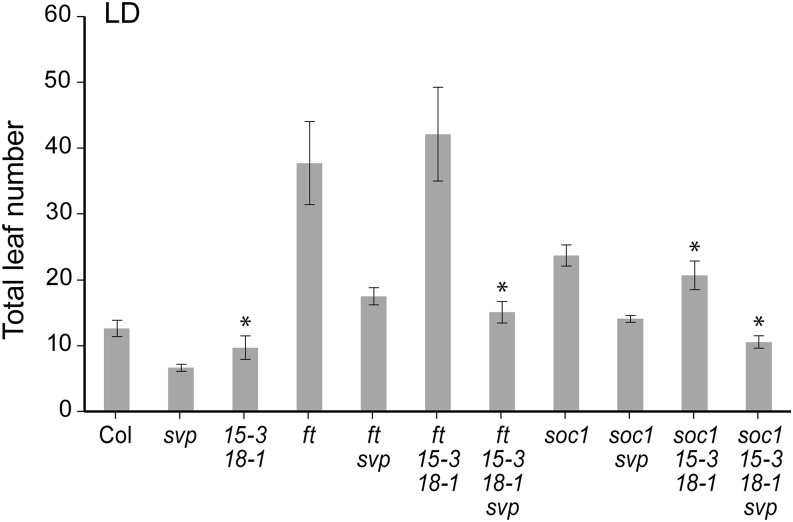
Figure 1.
Genetic interactions between agl15, agl18, and svp mutations in backgrounds containing ft and soc1 mutations. Flowering time was measured under LD conditions. Asterisk indicates mutant combinations where the addition of agl15 agl18 mutations results in statistically significant differences (P < 0.01) in the means. The means ± 1 sd are shown (n ≥ 17 plants). Col, Columbia.

