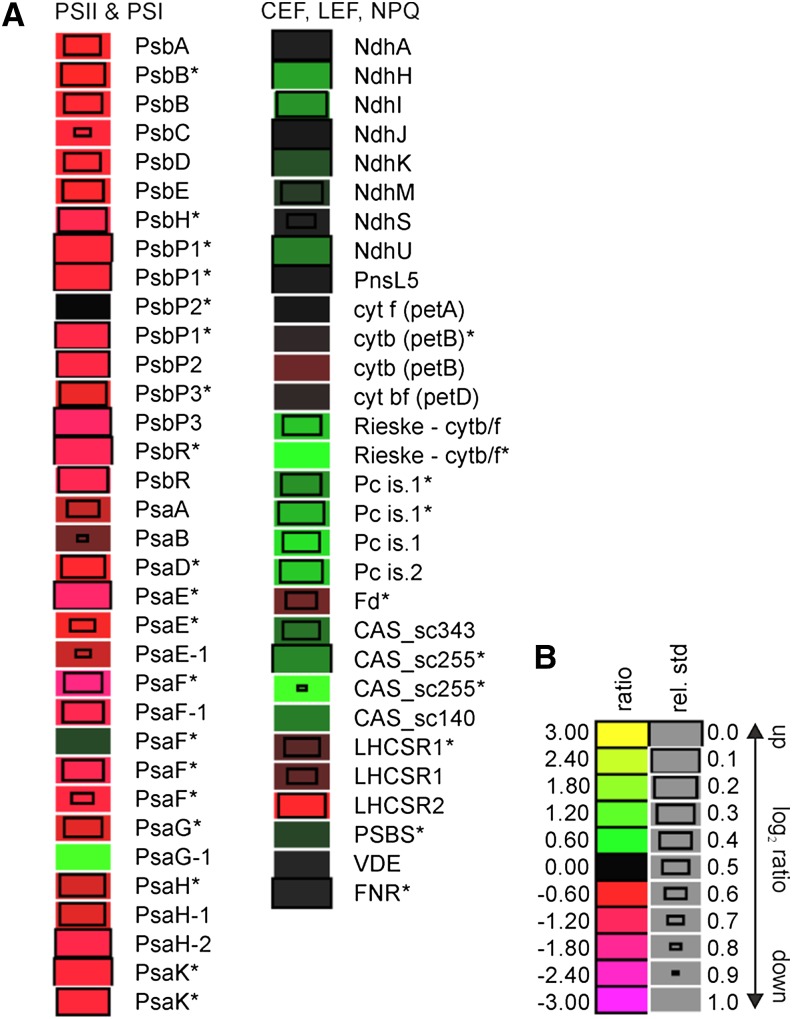
Figure 3.
Relative abundance of photosynthetic proteins in the P. patens pgrl1 compared with the wild type after short-term anoxia (AN). Protein expression levels were determined by comparative proteomics approach. After 7-h bubbling with argon, pgrl1 and wild-type protonema were harvested, and total protein was extracted. Equal protein amount (40 µg) from each sample was mixed and analyzed. In this graph, the ratios of the 14N labeled (pgrl1) versus 15N labeled (wild type) are presented. A, Protein ratios shown in the figure are based on two independent experiments (log2 transformed). Asterisks indicate proteins that have been quantified in a group of proteins. A log2 ratio greater than 0 (pgrl1/wild type) indicates an increase (green), a log2 ratio less than 0 indicates a decrease (red) in abundance in pgrl1, and a log2 ratio of zero indicates no changes in protein levels. PSI components were annotated as reported by Busch et al. (2013), whereas, for NDH complex, the annotation of Armbruster et al. (2013) was followed. B, Legend to heat map showing log2 values that correspond to different shades of red and green. Relative sd of a ratio is reflected by the size of the boxes.

