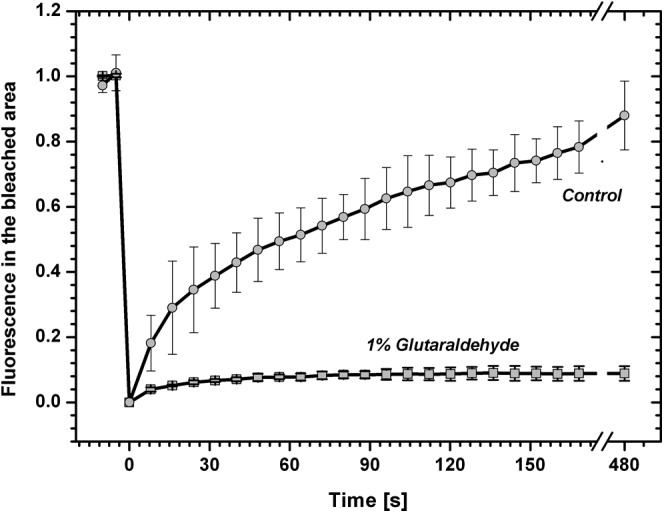
Figure 2.

Time course of PBsome fluorescence recovery at the center of the bleached thylakoid of P. cruentum. The FRAP routine was measured for a control cell or with 1% glutaraldehyde, which cross links proteins and stops protein diffusion. Data were calculated from the FRAP image sequence presented in Figure 1; values are relative to fluorescence prior to bleaching, and the typical bleach depth before normalization was about 40% of the initial fluorescence. Data represent average values and sd for n = 9 with three biological replications.
