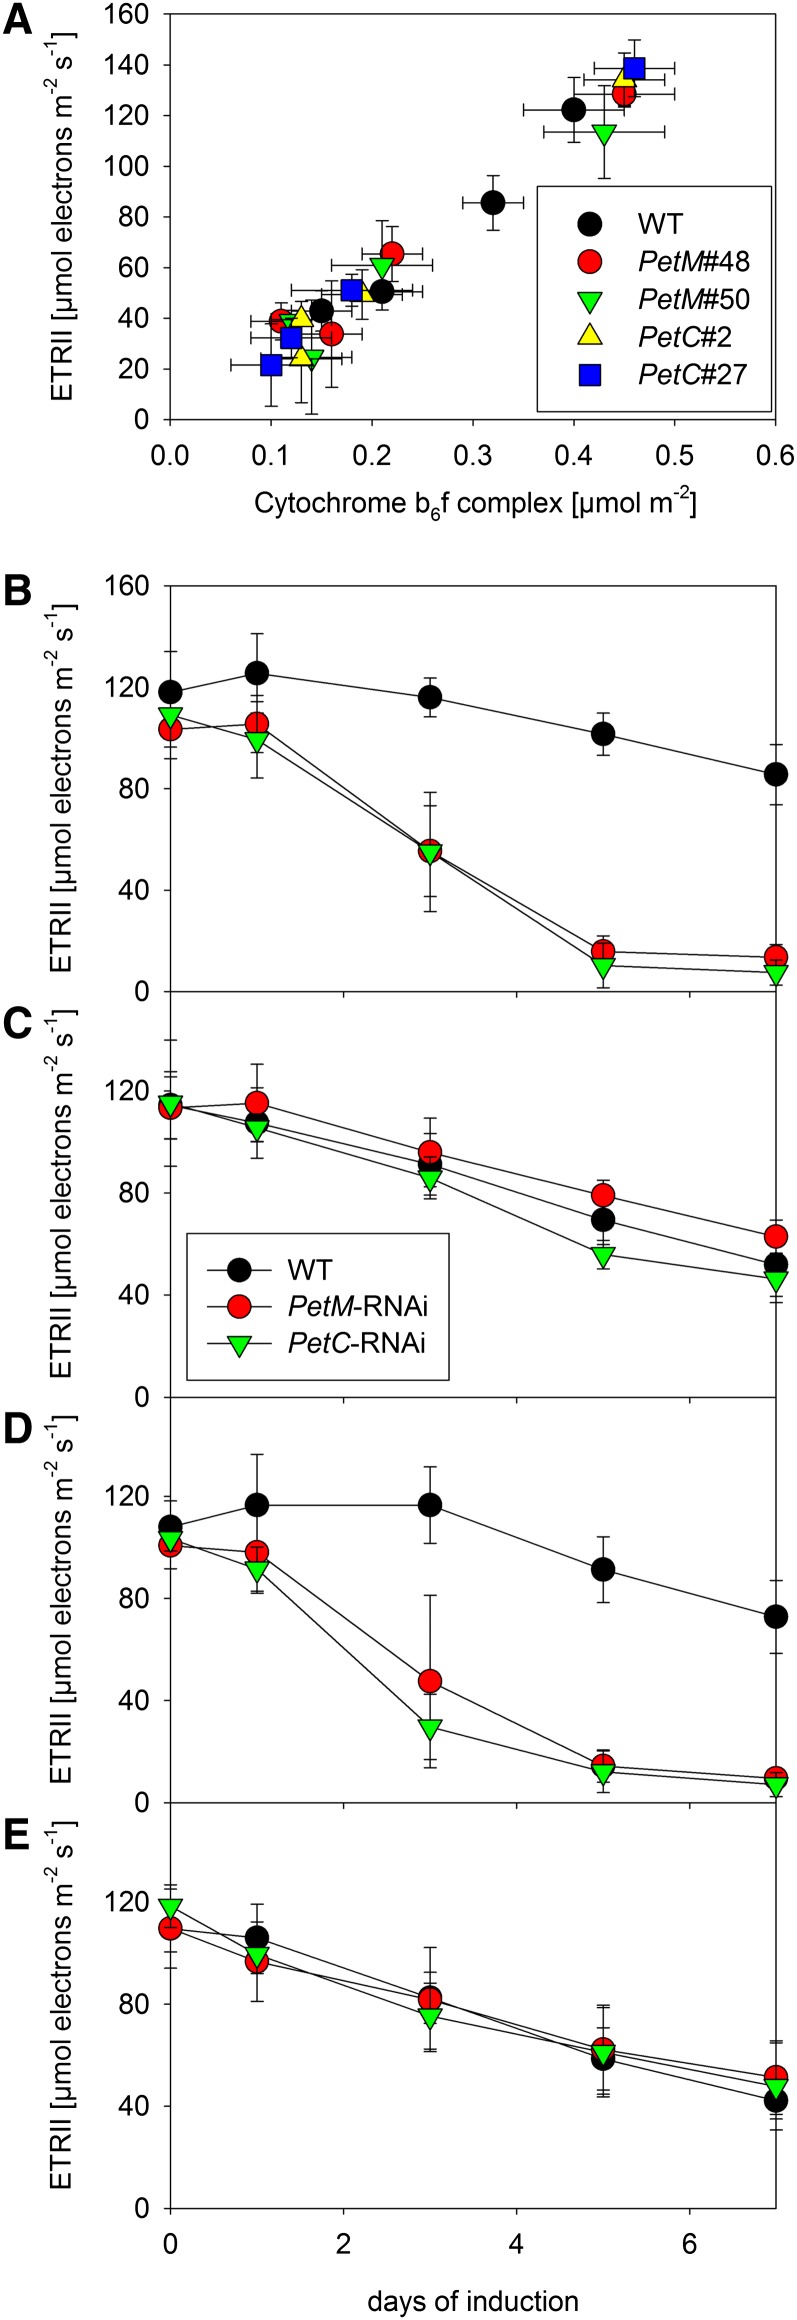
Figure 6.
ETRII as an in vivo measure of cyt-bf content. A, Correlation between light-saturated linear electron transport capacity per leaf area with cyt-bf contents per leaf area. B to E, Changes in linear electron transport capacity in young, expanding (B and D) and mature leaves (C and E) of wild-type (WT) tobacco and RNAi plants under standard growth conditions (B and C; 250 µmol photons m–2 s–1) and during 7 d of high-light stress (D and E; 1,000 µmol photons m–2 s–1). Error bars represent the sd.

