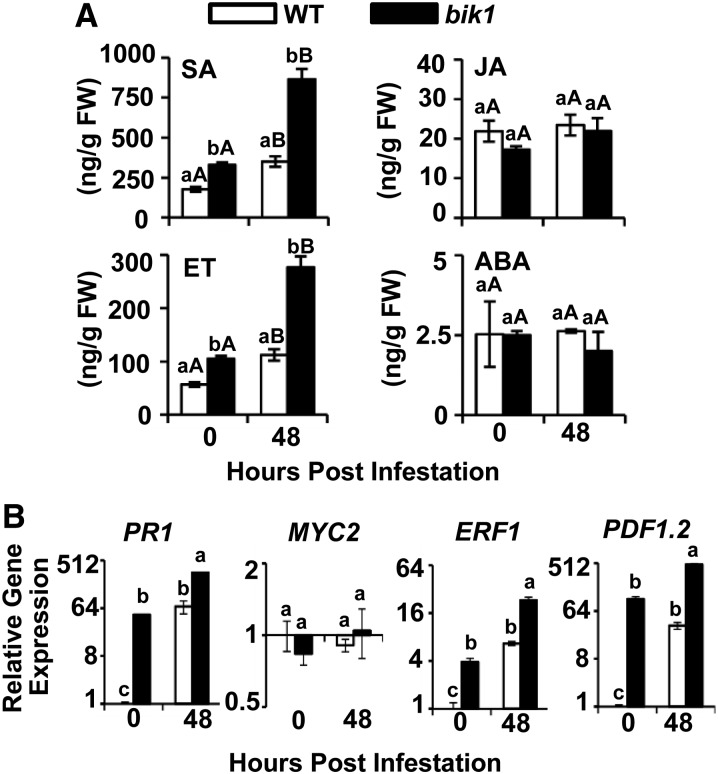
Figure 4.
bik1 shows higher basal and induced levels of SA and ET and elevated expression of their marker genes during aphid infestation than the wild type (WT). A, SA, JA, ABA, and ET levels in the wild type and bik1 before and after aphid infestation. Three-week-old plants were infested with aphids for 48 h. Four replicates were used for each genotype. Hormone measurements were performed as described in “Materials and Methods.” Data were analyzed by the independent samples’ Student’s t test (P < 0.05). Different lowercase letters indicate significant differences between genotypes within the same treatment. Different uppercase letters indicate significant differences between treatments within the same genotype. B, Relative expression of SA, JA, and ET marker genes PR1, MYC2, ERF1, and PDF1.2 in response to aphid feeding at 0- and 48-h time points. Data were analyzed by one-way ANOVA. Tukey’s multiple range test analysis was used for pairwise comparisons of the difference between treatments for mean separation (P < 0.05). FW, Fresh weight.

