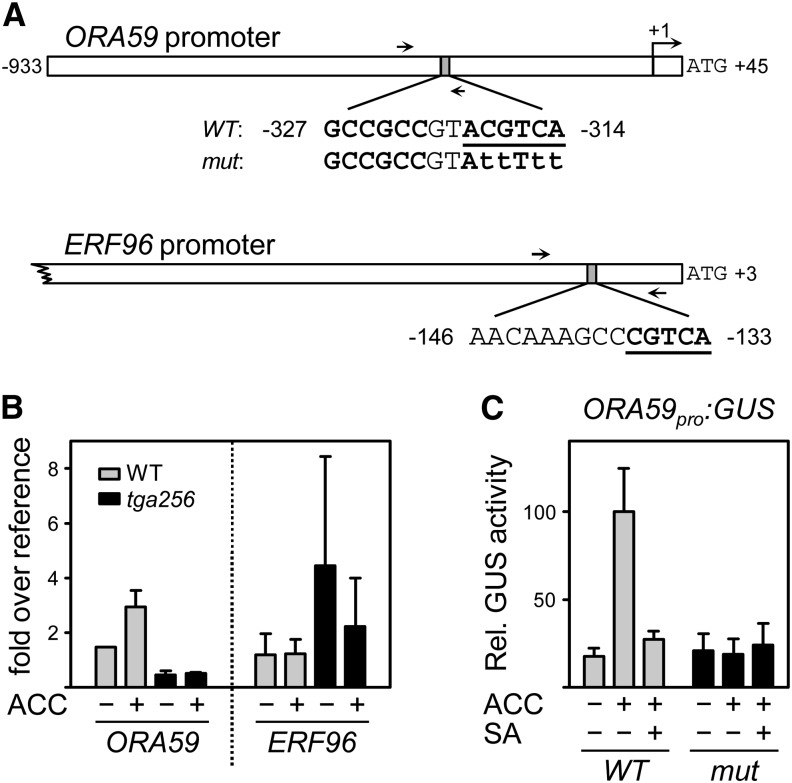
Figure 5.
Analysis of TGA binding to the ORA59 promoter and functional analysis of the inverted TGACGT motif. A, Schematic diagram of the ORA59 and the ERF96 promoters highlighting the sequence around the putative TGA binding sites (bold and underlined) and the GCCGCC box in the ORA59 promoter (bold). Arrows denote the position of the primers used for amplification of promoter fragments after ChIP. The transcriptional start site of ORA59 is marked by a bent arrow (position +1). The indicated ORA59 fragment was cloned upstream of the GUS gene with either the intact ACGTCA motif or the indicated point mutations (small letters). B, ChIP analysis. Four-week-old soil-grown wild-type and tga256 mutant plants were treated with 1 mm ACC or water for 24 h. Ten plants were combined per treatment and per experiment. Chromatin samples were subjected to immunoprecipitation using the aTGA2,5 antiserum. The coimmunoprecipitated DNA was recovered and analyzed with quantitative PCR using the primer pairs as indicated above. A genomic fragment of ACTIN8 was used as a reference. The average values (± se) from two experiments with independently grown plants are shown. C, GUS activities of transgenic plants carrying the wild type and the mutated ORA59pro:GUS constructs as depicted in A. Values represent the average relative GUS (Rel. GUS) activities (± se) from 22 independent F2 lines per construct. The average GUS activity yielded by the ACC-induced ORA59 promoter was set to 100%. Plants were treated with either water, 1 mm ACC, or 1 mm ACC and 1 mm SA and harvested after 24 h. The values of the individual lines are shown in Supplemental Figure S2. WT, Wild type.

