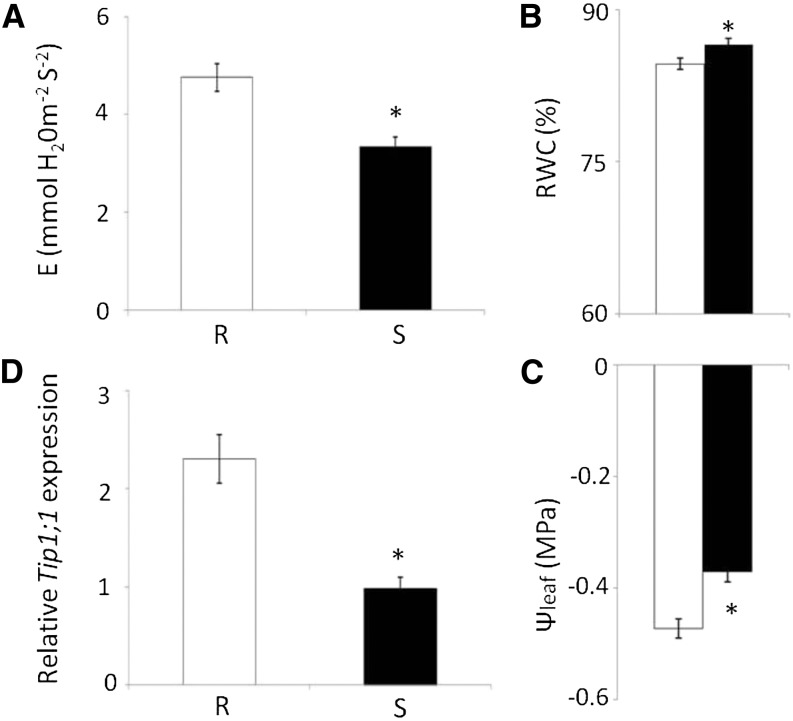
Figure 1.
Comparison of water management in R (white bars) and S (black bars) tomato plants. A, Leaf transpiration (E). B, Leaf RWC. C, SlTIP1;1 expression as measured by quantitative PCR (qPCR). D, ψleaf. Asterisk indicates a significant difference (Student’s t test, P < 0.05). Data points are means ± se (n = 7–30).

