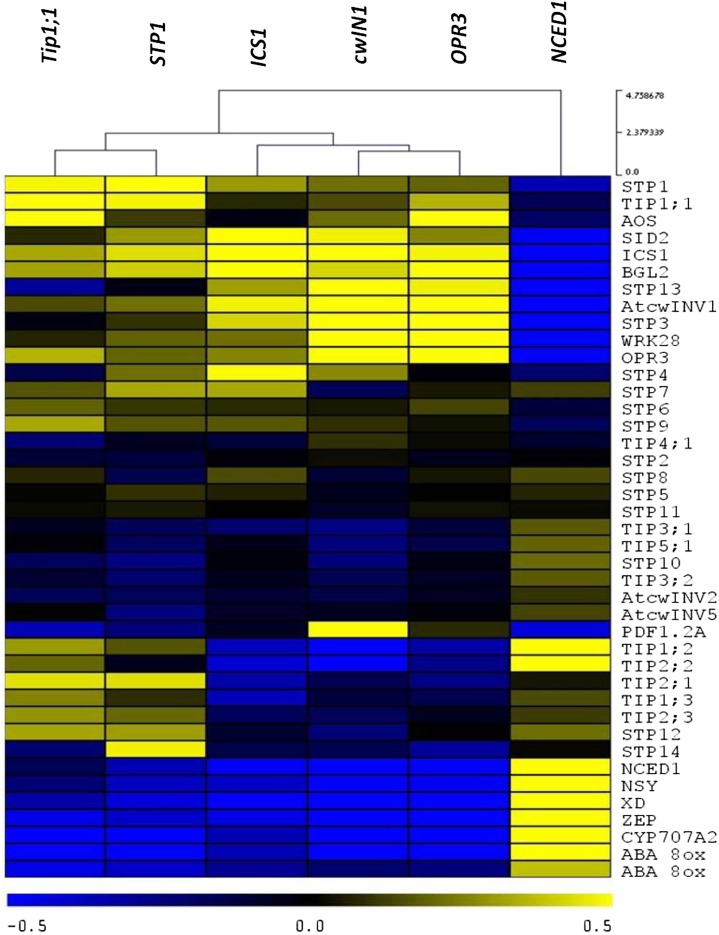
Figure 8.
Hierarchical clustering of coexpression microarray data derived from Arabidopsis in the presence of several sources of biotic stress (the different pathogens listed below). Blue represents a negative correlation, and yellow represents a positive correlation. The heat map shows the correlations between the genes TIP1;1, STP1, cwINV1, OPR3, and ICS1. NCED1 shows an opposite trend. Pearson correlation coefficient values were calculated for all of the gene pairs in the matrix using the Web-based tool Expression Angler. A subset of expression values derived from the AtGenExpress Pathogen Compendium was used for the calculation. This subset included all of the expression values recorded for experiments in which there was a response to infection by one or more of four different pathogens (P. infestans, B. cinerea, Pseudomonas spp., and Erysiphe orontii).

