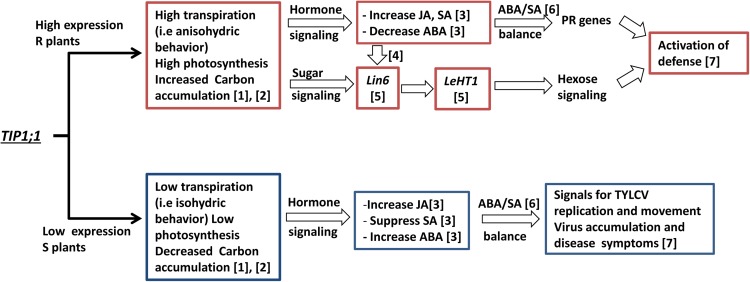
Figure 9.
Flow chart describing the possible role of TIP1;1 in hormone and sugar signaling leading to resistance to TYLCV in R and S plants. 1, Sade et al. (2012). 2, Figure 1; Supplemental Figure S1. 3, Figures 4 to 6; Supplemental Figure S6; Huang et al. (2012). 4, Proles et al. (2009). 5, Figure 7. 6, Figures 4 to 6; Supplemental Figure S6. 7, Figure 2. [See online article for color version of this figure.]

