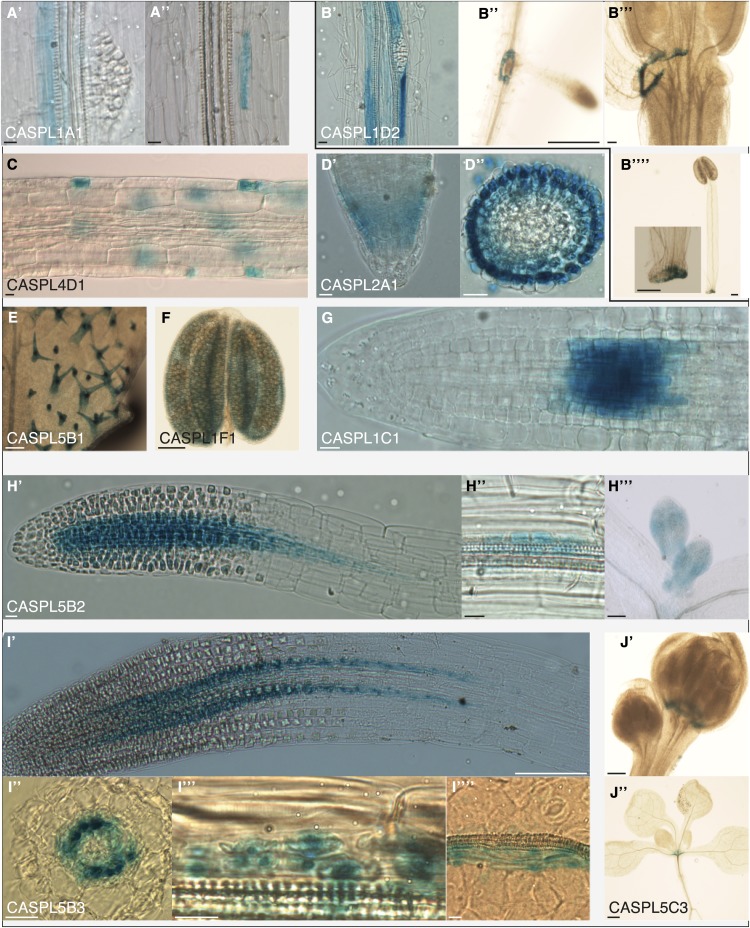
Figure 5.
AtCASPLs are expressed in different tissues. A, AtCASPL1A1 is expressed in the endodermis at late stages, initially in all cells (′), later only in isolated cells (′′); its expression is reduced in the endodermis overlaying lateral root primordia (′). B, AtCASPL1D2 is expressed in late endodermis, particularly in cells overlaying lateral root primordia (′); expression persists at the base of emerged lateral roots (′′); it is also expressed in the floral organ abscission zone (′′′) on the side of the shed organ (′′′′). C, AtCASPL4D1 is expressed in root epidermis from the maturation zone; its expression quickly declines. D, AtCASPL2A1 is expressed in the lateral root cap (′; D′′ shows a transverse section of the root tip); it is also expressed in leaves (data not shown). E, AtCASPL5B1 is expressed in immature and differentiated trichomes in leaves. F, AtCASPL1F1 is expressed in anthers. G, AtCASPL1C1 is expressed in the root maturation zone. H, AtCASPL5B2 is expressed in dividing cells in the root (′), lateral root primordia (′′), and leaves (′′′). I, AtCASPL5B3 is expressed in root xylem pole pericycle (′), lateral root primordia (′′′), and leaves (′′′′); I′′ shows a transverse section at the root tip. J, AtCASPL5C3 is expressed early in the floral organ abscission zone (′) and in the rosette vestigial abscission zone (′′). All images represent whole-mount stainings, except D′′ and I′′. Bars = 10 µm for A, B′, B′′′, C, D, H′, H′′, I′′, I′′′, and I′′′′′; 100 µm for B′′, B′′′′, E, F, H′′′, I′, and J′; and 500 µm for J′′. [See online article for color version of this figure.]

