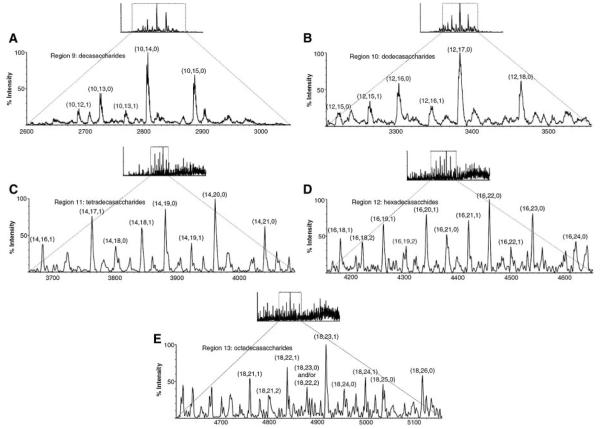
FIGURE 3.
Summed mass spectra from different regions in the TIC chromatogram shown in Figure 2 (Henriksen, Ringborg, & Roepstorrf, 2004). The components are categorized by (X, Y, Z), as defined in Figure 2 legend. © 2004 John Wiley and Sons, Limited. Reproduced with permission.

