FIGURE 4.
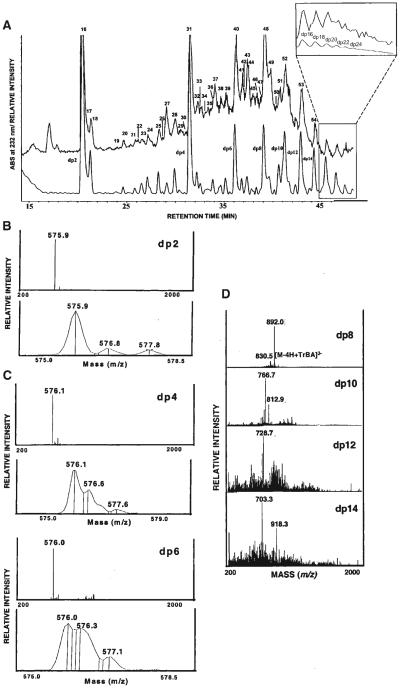
A: RPIP-HPLC separation of heparin oligosaccharides obtained from controlled (30%) heparinase depolymerization of bovine lung heparin. A total ion chromatogram using negative ESI-MS detection (upper trace) with peaks numbered and a UV chromatogram at 232 nm (lower trace) with degree of polymerization (dp) of peaks are shown. The inset shows the expanded view of both the total ion chromatogram and the UV chromatograms of higher oligosaccharides assigned to dp16 –dp28 by peak counting. Negative mode ESI mass spectra of the fully sulfated heparin oligosaccharides ranging in size from disaccharide (dp2, B), hexasaccharide (dp6, C) to tetradecasaccharide (dp14, D). The full scan spectra (upper panel) and narrow range spectra showing isotope distribution (lower panel) are presented for the oligosaccharides of dp2–dp6 (Thanawiroon et al., 2004). © 2004 The American Society for Biochemistry and Molecular Biology, Inc., Reproduced with permission.

