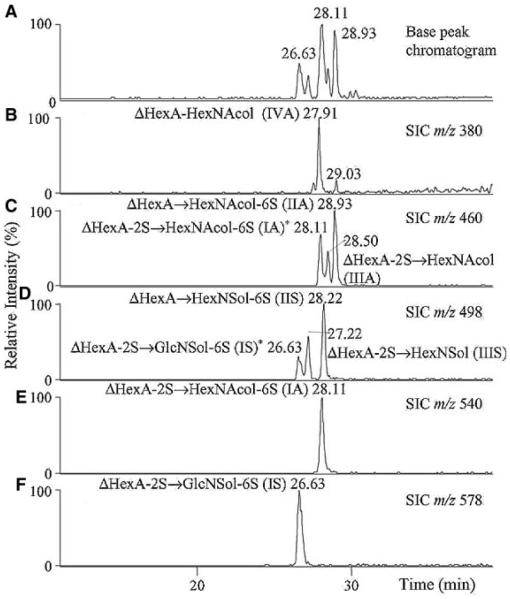
FIGURE 7.
Separation and detection of heparan disaccharides (100 ng each) using negative ion graphitized carbon LC–MS. Panes (A–F) include base peak chromatogram and single ion chromatograms (SIC) of detected [M – H]− ions. Structures assigned with an asterisk (*) indicate that these structures were detected in these SIC due to in-source fragmentation with loss of sulfate (S) as [M – H – S]− ions (Karlsson et al., 2005). © 2005 Elsevier Limited. Reproduced with permission.

