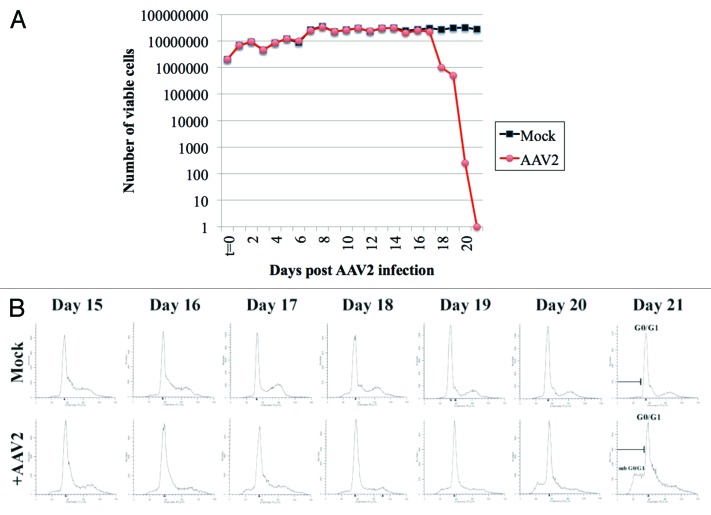
Figure 1. AAV2 infection of MD-MB-435 cells induces steady decrease in cell viability which results from virus induced cell death. (A) Viability of MDA-MB-435 breast cancer cells infected with AAV2. Synchronized MDA-MB-435 cells were infected with AAV2. Both mock and virus-infected cells were grown to 80% confluence (day 2) and passaged 1:2, followed by further growth and passaging again at a 1:2 ratio on days 5, 7, 11, 13, 17, and 20 as indicated by arrows. At each time point, cells were counted using the trypan blue exclusion method. Graph generated is representative of 3 independent experiments. (B) Apoptotic death of AAV2-infected MDA-MB-435 cells was determined using FACS analysis. On the days indicated, both mock and AAV2-infected cells were stained with propidium iodide and the histogram of the cell cycle profile was used to determine the appearance of the sub-G0-G1 fraction that progressively increased with days in culture. FACS analysis is representative of 3 independent experiments.

An official website of the United States government
Here's how you know
Official websites use .gov
A
.gov website belongs to an official
government organization in the United States.
Secure .gov websites use HTTPS
A lock (
) or https:// means you've safely
connected to the .gov website. Share sensitive
information only on official, secure websites.
