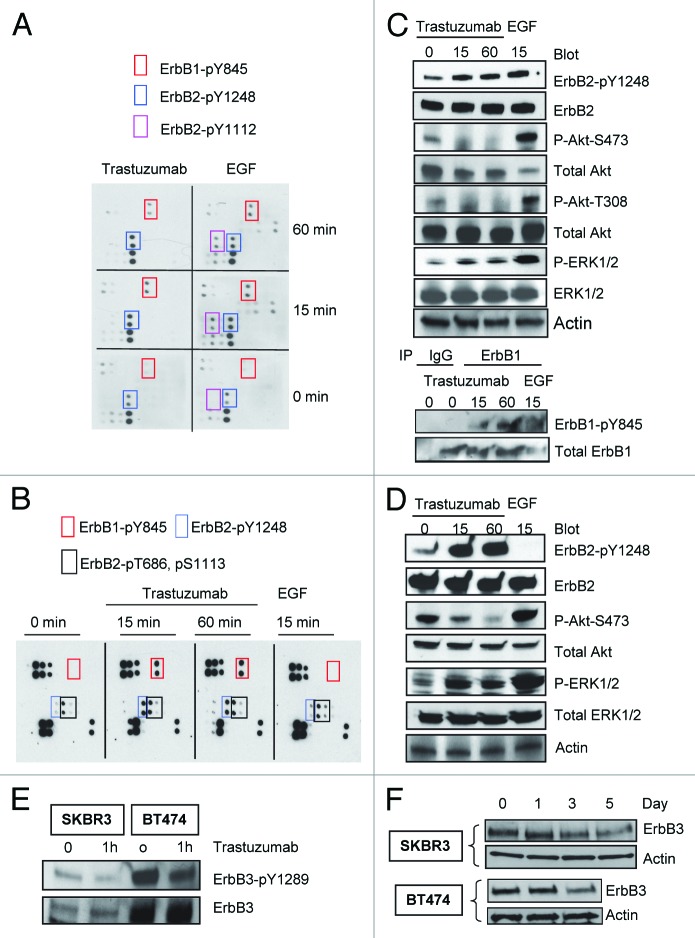
Figure 1. Trastuzumab induces phosphorylation of ErbB2-Y1248 and ErbB1-Y845, inhibits Akt phosphorylation and downregulates ErbB3 in trastuzumab-sensitive SKBR3 and BT474 cells. (A) SKBR3 cells (2 × 10⁶) were plated in 10 cm dishes, serum-starved overnight and treated either with trastuzumab (4 μg/mL) or EGF (100 ng/mL) for the indicated times or left untreated. After harvesting, the whole cell lysates (WCL) were incubated with RayBio human EGFR phosphorylation antibody array 1 according to the instructions provided by the manufacturer. The pair of dots in red rectangles indicates phosphorylated ErbB1-Y845 (ErbB1-pY845); blue rectangles indicate ErbB2-pY1248; purple rectangles indicate ErbB2-pY1112. The map of EGFR phosphorylation antibody array 1 is available at http://www.raybiotech.com/. (B) Changes in phosphorylation, as detected by RayBio human EGFR phosphorylation antibody array 1, following treatment of BT474 cells with trastuzumab or EGF for the indicated times. The experimental procedures were essentially the same as described under (A). Red rectangles indicate phosphorylation signal for ErbB1-Y845; blue rectangles indicate phosphorylation signal for ErbB2-pY1248. Black rectangles indicate phosphorylation signal for ErbB2-pT686 and pS1113 (from left to right). The experiments with RayBio human EGFR phosphorylation antibody array 1 were repeated at least twice for both cell lines. (C) SKBR3 cells were serum-starved and incubated either with trastuzumab or EGF for the indicated times. The cells were harvested and the levels of ErbB2-pY1248, ErbB1-pY845, P-Akt-T308, and P-Akt-S473 or P-ERK1/2 and total levels of the indicated proteins in WCL were determined by western blot analysis. Actin western blot analysis of WCL was done to control for equal loading (note: from here on, actin western blots were used to control for equal loading in all figures). Bottom two panels, levels of ErbB1-pY845 and total ErbB1 were determined in ErbB1 immunoprecipitate by western blot analysis. (D) Western blot analysis of BT474 cells treated either with trastuzumab or EGF. The experimental procedures were essentially the same as (C). (E) SKBR3 and BT474 cells were serum-starved overnight and treated with trastuzumab for 1 h or left untreated. The levels of phosphorylated ErbB3-Y1289 (ErbB3-pY1289) and total ErbB3 were detected by western blot analysis using antibodies directed against ErbB3-pY1289 or ErbB3. (F) The cells were grown in the media supplemented with 10% FBS and then treated with trastuzumab (10 μg/mL) for the indicated times. WCL harvested from indicated cells were subjected to western blot analysis. The levels of ErbB3 in WCL were detected using an antibody directed against ErbB3.

An official website of the United States government
Here's how you know
Official websites use .gov
A
.gov website belongs to an official
government organization in the United States.
Secure .gov websites use HTTPS
A lock (
) or https:// means you've safely
connected to the .gov website. Share sensitive
information only on official, secure websites.
