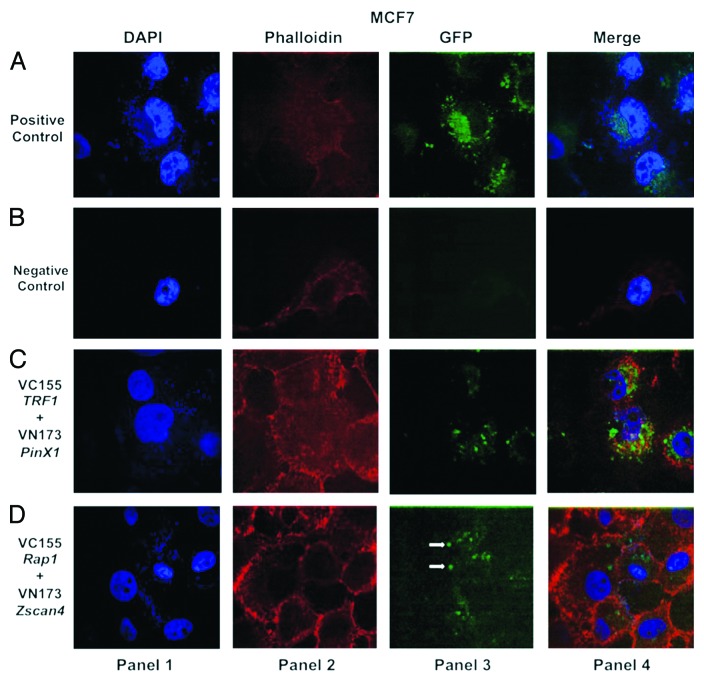
Figure 2. Confocal images of bimolecular fluorescence complementation (BiFC) results in MCF7 cancer cells. DNA was labeled with DAPI (blue, shown in panel 1). Actin filaments were labeled with a fluorescent phalloidin (red, shown in panel 2). Panel 3 is the BiFC signal generated by interaction of the GFP fluorophore components based on proximity. The last panel (panel 4) represents the merged images. (A) GFP signal (green) (shown in the panel 3) was used as a positive control for transfection efficiency in MCF7 cancer cells. The corresponding overlaid images are shown in the last panel. (B) Two vector fragments (pBiFC-VC-155 and pBiFC-VN-173) (shown in panel 3) were used as negative control for BiFC in MCF7 cancer cell line. (C) Two vector fragments (pBiFC-VC-155-TRF1 and pBiFC-VN-173-PinX1) were combined to produce a bimolecular fluorescent complex (green, shown in panel 3). (D) Visualization of Zscan4 and Rap1 complex in MCF7 cancer cells using BiFC analysis (green, shown in panel 3). The images (shown in panel 3) are representative of BiFC analysis for the interaction between Zscan4 and Rap1. Images were generated under an Olympus APON 60X TIRF NA 1.4 objective.

An official website of the United States government
Here's how you know
Official websites use .gov
A
.gov website belongs to an official
government organization in the United States.
Secure .gov websites use HTTPS
A lock (
) or https:// means you've safely
connected to the .gov website. Share sensitive
information only on official, secure websites.
