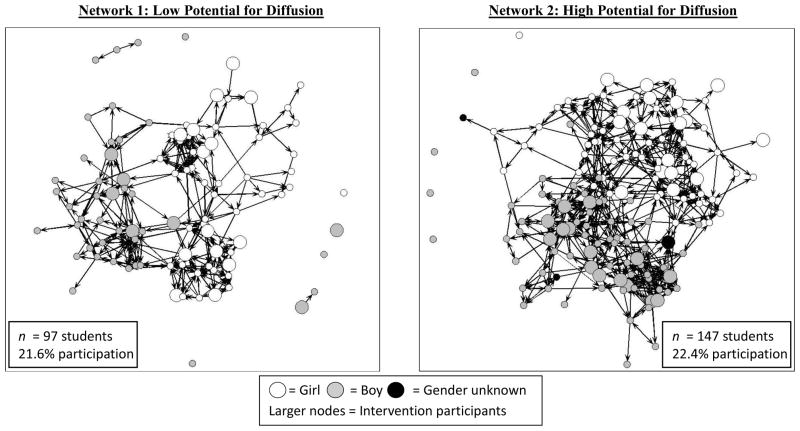
Figure 1.
These plots show the pretest friendship nominations (directional arrows) among 6th grade students in two networks and highlight the discriminant validity between the traditional analytic measures and SNA measures of diffusion potential. Both Network 1 (left) and Network 2 (right) had similar participation rates and were similarly representative in terms of gender (Net1 = −0.15; Net2 = −0.06), free lunch status (Net1 = −0.24; Net2 = −0.15), delinquency (Net1 = −0.03; Net2 = −0.06), and substance use attitudes (Net1 = −0.08; Net2 = −0.05), but they have very different network structure. Network 1 ranked 27th on the global network index whereas Network 2 had the highest rank. Compared to Network 2, Network 1 was less cohesive (Net1 = 2.85 vs. Net2 = 3.69) and more clustered (e.g., segregation index: Net1 = .73 vs. Net2= .63). Several participants in Network 1 were isolated from the network, and overall the participants received fewer friendship nominations (e.g., Cohen’s D for indegree: Net1 = 0.09 vs. Net2 = 0.32). As a result, Network 1 also had fewer non-participants within two steps of an SFP10-14 participant compared to Network 2 (58% vs. 82%).

