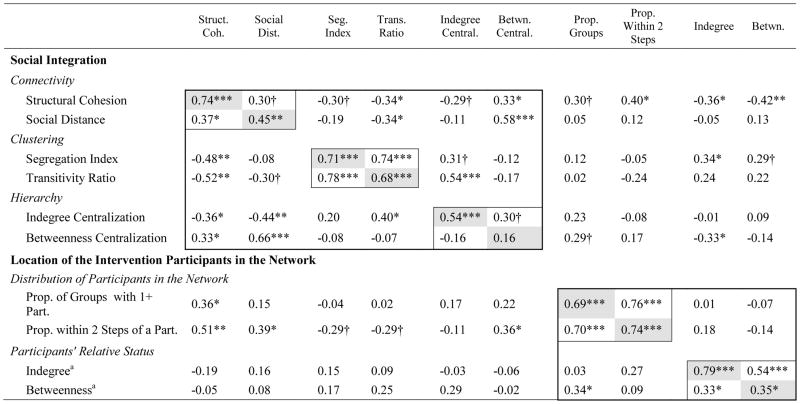
Table 2.
Convergent Validity: Partial Correlations among SNA Measures of Diffusion Potential

|
Note. Prop = proportion; Part = Intervention participant. Survey participation and network size were partialed out of all scores. Values above the diagonal are pretest correlations, values below the diagonal are posttest correlations. Values along the diagonal are the correlations between pretest and posttest.
Measure was scored as the Cohen’s D effect size between participants and non-participants. Positive values indicate that participants were higher than non-participants with respect to that measure.
p < .10.
p < .05.
p < .01.
p < .001.
