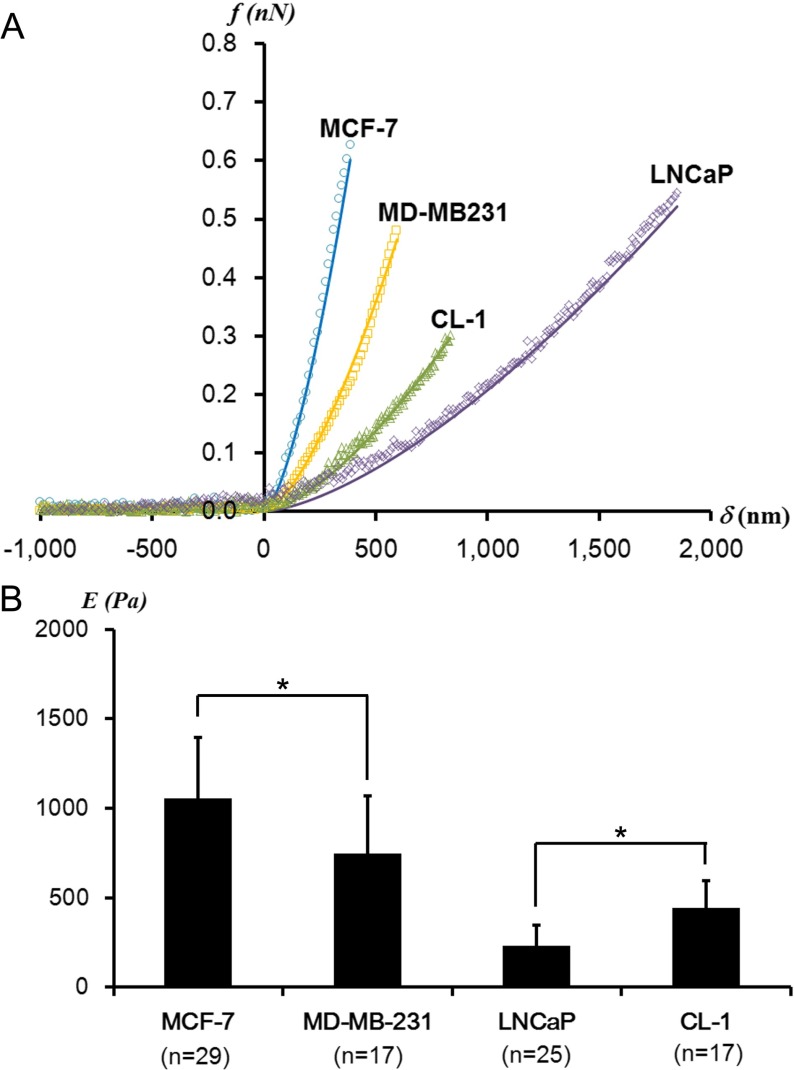
Fig. 1.
a Representative f-δ curves obtained from prostate (CL-1 and LNCaP) and breast (MCF-7 and MD-MB231) cancer cells. The data obtained from the cell centers (dots) fit well with the Hertz model (solid lines). b The average elastic moduli determined from CL-1, LNCaP, MCF-7, and MD-MB231 cells at cell centers (*p < 0.01). n indicates the number of cells investigated. There is no statistical difference in the trigger forces applied on all investigated cells

