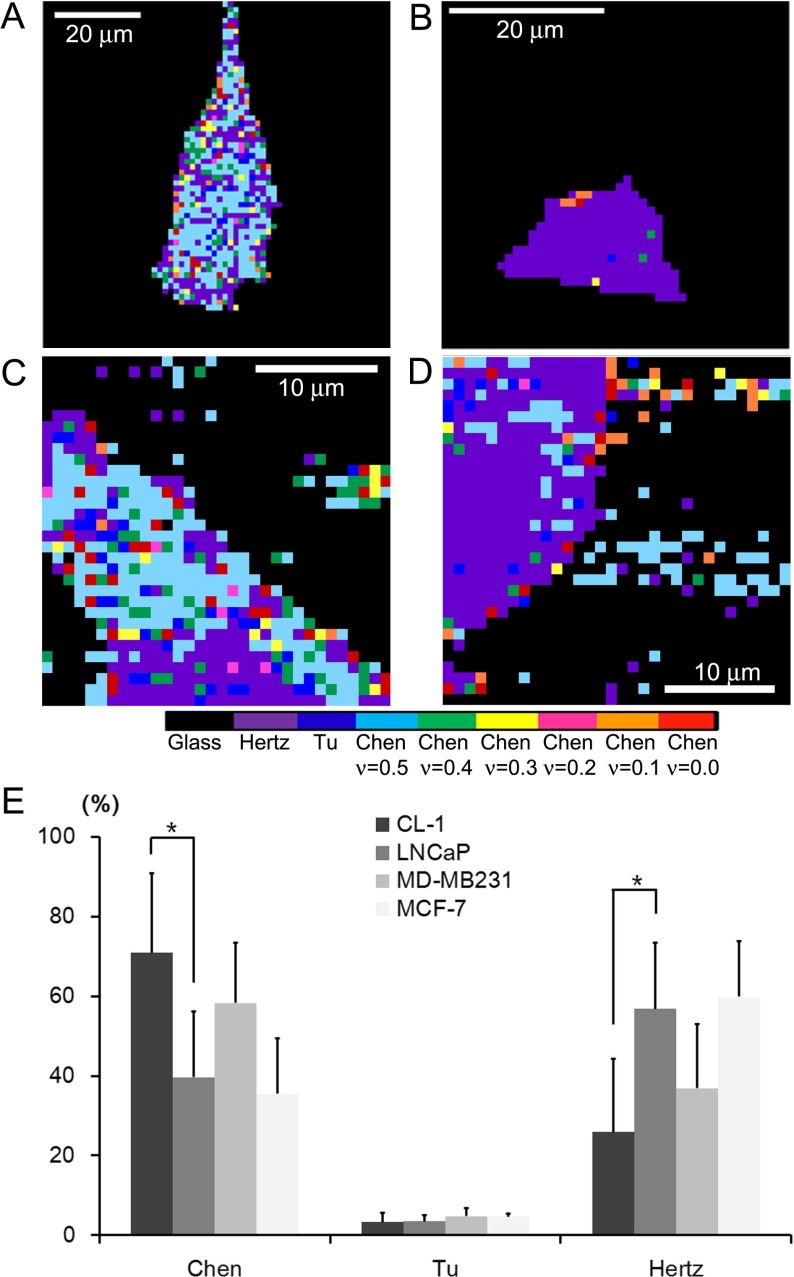
Fig. 2.
Adhesion maps derived from 2D f-d curves obtained from a CL-1, b LNCaP, c MD-MB231, and d MCF-7 cells. The resolutions of images are 1.27 μm, 1.00 μm, 1.56 μm, and 0.97 μm per pixel for a, b, c, and d, respectively. The adhesive maps were acquired by determining the mathematical model that most well describes the homogeneous elastic behavior for local nano-domains of a cell. The colors correspond to the following models, except for black, which represents the glass substrates: from left to right, the Hertz, the Tu, and the Chen models with varying Poisson ratio of 0.5, 0.4, 0.3, 0.2, 0.1, and 0.0. The Chen model represents well-adhered regions of cells on a substrate. e The mathematical model yielding the most constant elastic moduli over the observed indentation range was counted for each cell line. Compared to LNCaP cells, the Chen model was dominantly adopted to calculate the elastic moduli of CL-1 cells, indicating an enhancement of the cell–substrate adhesion (*p < 0.01). We did not observe any significant difference in the mathematical models used between breast cancer cells. The Tu model was hardly used for the cells investigated

