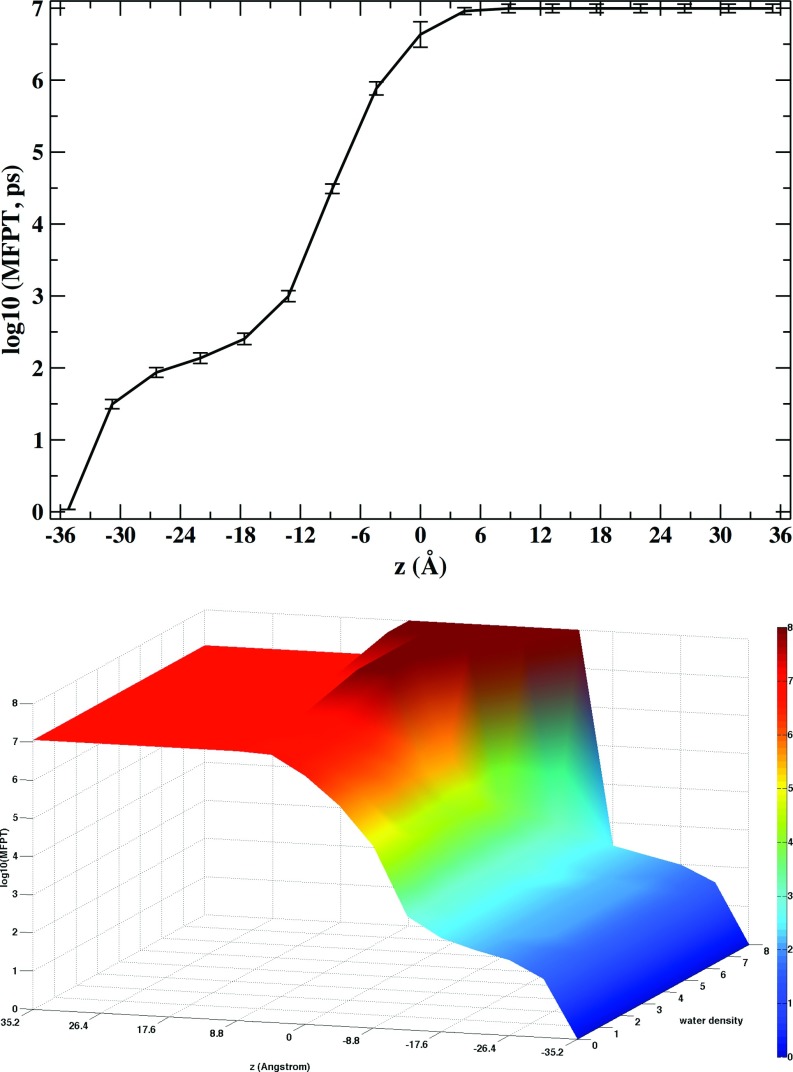
FIG. 10.
Mean first passage time for water permeation through the membrane. (Top) Projection of the MFPT along the membrane axis. Error bars are obtained by comparing water permeation estimates starting on opposite sides of the membrane. (Bottom) The projection of the MFPT over the membrane axis and water density. This surface shows permeation times for water molecules moving from the negative to the positive z-layer. The MFPT is slightly dependent on the water density before the barrier is reached.

