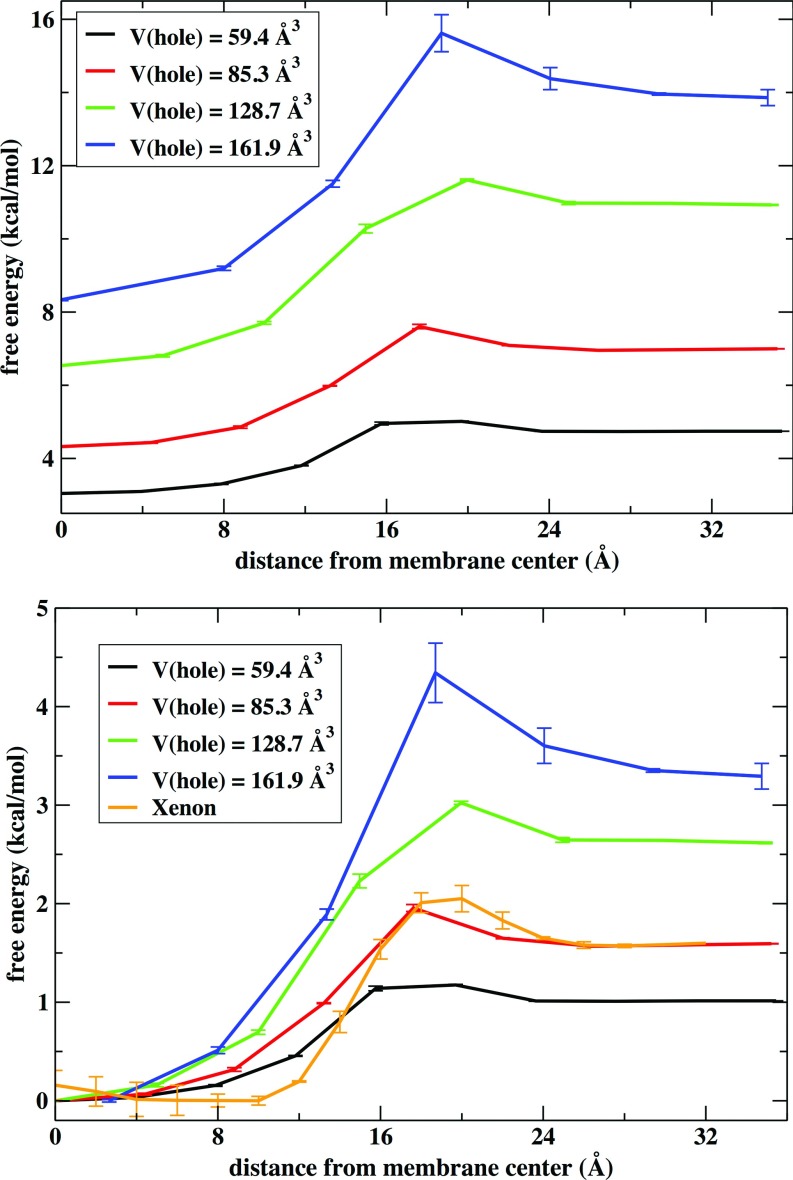
FIG. 12.
(Top) Free energy of hole formation as a function of the distance from the center of the membrane. Results are shown for different volumes of the grid used to discretize the density data. Error bars are obtained by comparing results from the two membrane layers. (Bottom) it shows the same free energy normalized along z and with the free energy shifted to zero at the center of the membrane. The orange curve is the PMF for permeation of a xenon atom. The van der Waals diameter of xenon is 4.3 Å, smaller than the size of the cubic grid cell of volume 85.3 Å3 shown in red (with a 4.4 Å side).

