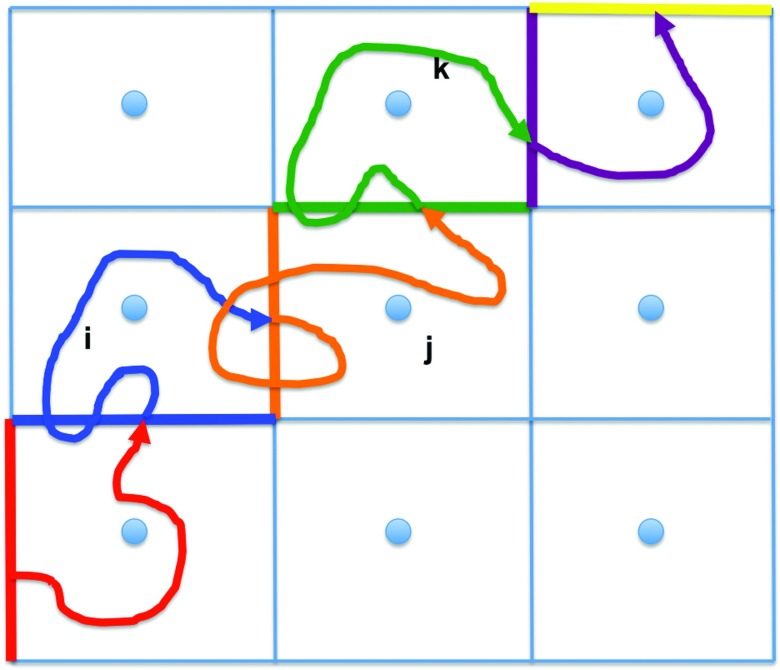
FIG. 4.
Simple representation of the Milestoning algorithm. The blue circles are anchors and the straight lines are milestones (interfaces) separating the different anchor domains in the system. In the present case anchors are located at the center of every grid cell and there are different anchors depending on the number of atoms present in the cell. The curve line represents a long trajectory that has been partitioned into trajectory fragments depending on the last milestone that the long trajectory has crossed. The red trajectory fragment starts at the red milestone and it belongs to the red milestone until it hits the blue milestone for the first time. At that moment the trajectory belongs to the blue milestone until it hits a neighboring milestone (the orange one) and so on.

