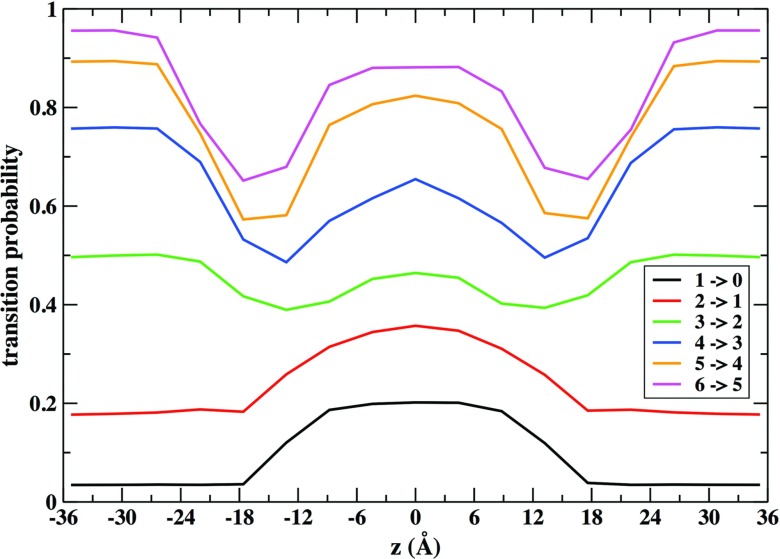
FIG. 6.
Probability of transition events between milestones that result in a decrease of the density of the cell is plotted as a function of the membrane axis. A transition event is defined as a change of cell density. When a cell contains one atom at a given time it can take one atom from other cell (transition 1 → 2) or lose that atom to a neighboring cell (transition 1 → 0). The sum of all transition probabilities is normalized to one.

