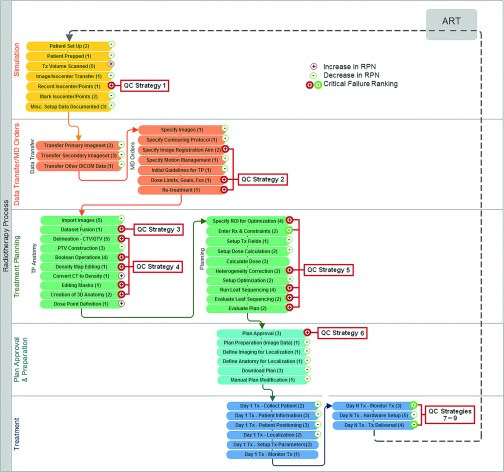
FIG. 4.
Flow diagram of major intensity-modulated ART processes and subprocesses. The number of failure modes per subprocess is included in parenthesis. Each subprocess is annotated to indicate an increase or decrease in average RPN of the associated failure modes. Critical failures are indicated by bold symbols. Process points necessitating QC strategies are also indicated. Corresponding QC strategies are listed in Table II. QC = Quality control.

