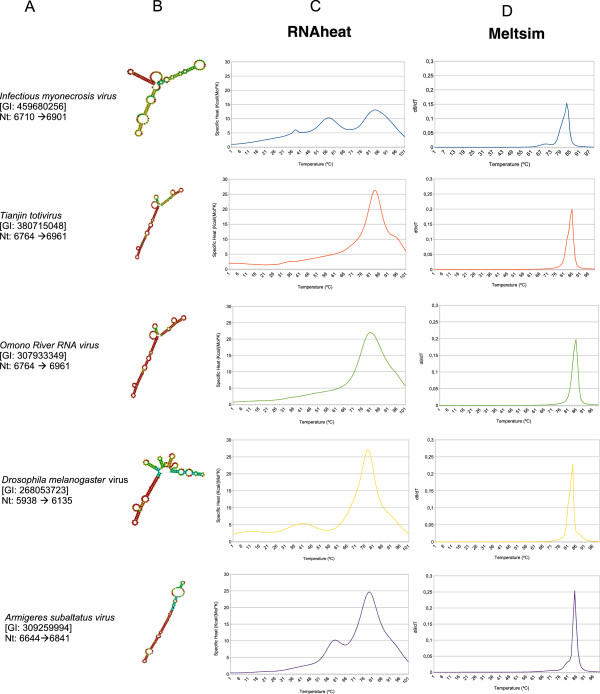
Figure 2.

Regions with conserved RNA secondary structures and their respective melting curves. This figure corresponds to analysis of IMNV-like group sequences. (A) Indication of regions with conserved secondary structure inside RdRp coding sequences, identified using RNAz. (B) Minimum free energy models calculated using RNAfold corresponding to each conserved region identified by RNAz. Structures are colored according to base-pairing probabilities. Red color denotes the high probability and purple denotes low probability of a given base is paired or not. For unpaired regions the color denotes the probability of being unpaired. (C and D) Melting curves calculated from conserved regions using softwares RNAheat and MELTSIM respectively.
