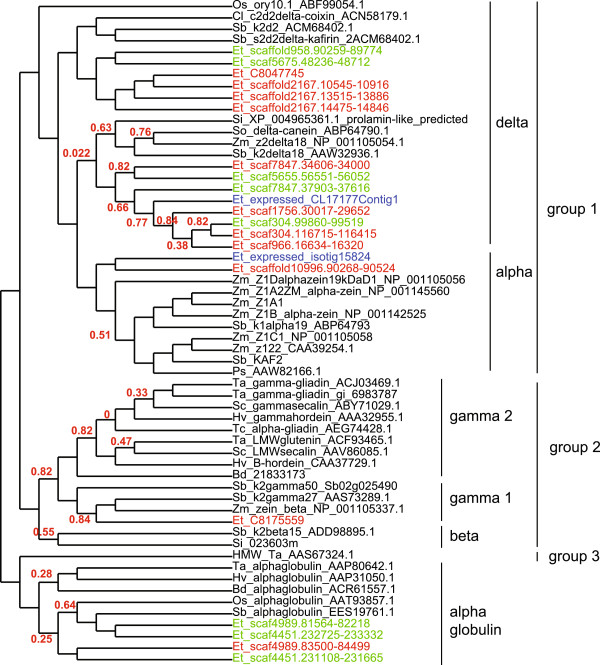
Figure 6.

Phylogenetic tree of prolamins in grasses. The protein sequences included in the analysis follow those of Xu and Messing [74] with the addition of tef sequences from this work. The repeat regions were edited out of all sequences which were then aligned using MAFFT. The ML tree was constructed using the WAG protein substitution model implemented in PhyML (version 3.0). The gamma shape parameter was fit to 2.845 and the proportion of invariant sites was estimated to be 0. Branch support was inferred using the conservative and non-parametric Shimodaira–Hasegawa-like (SH) aLRT provided by PhyML. Only branch support values less than 0.85 are shown. The tree is represented here by a cladogram so there are no meaningful branch lengths. Expressed tef sequences are in blue, tef sequences with a lesion (frame shift or stop codon in the coding region) are green and the remaining tef sequences are red. The grasses included are: Bd: Brachypodium distachyon; Cl: Coix lacryma; Et: Eragrostis tef; Hv: Hordeum vulgare; Os: Oryza sativa; Ps: Panicum sumatrense; Sb: Sorghum bicolor; Sc: Secale cereale; Si: Setaria italica; So: Saccharum officinarum; Ta: Triticum aestivum; Tc: Triticum compactum; Zm: Zea mays.
