Figure 2.
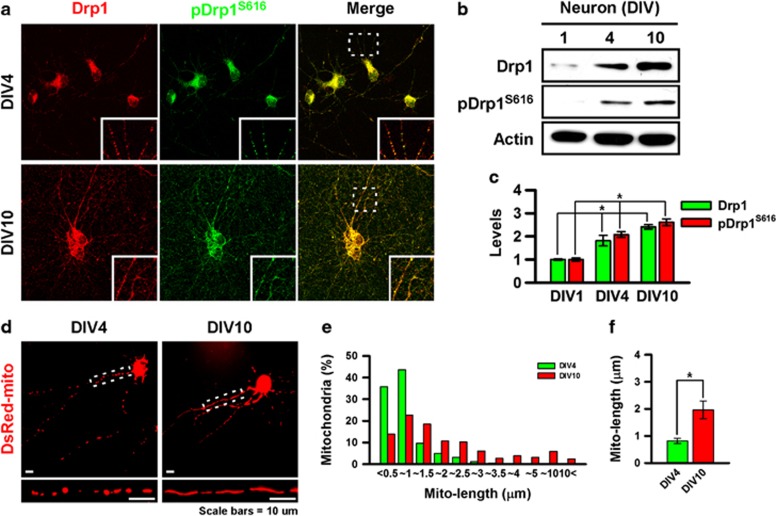
Phosphorylation of Drp1S616 and mitochondrial elongation during neuronal maturation. Immunocytochemical staining (a) and immunoblotting (b) of Drp1 and pDrp1S616 during the maturation of cultured cortical neurons in vitro. (c) Quantitative analysis of total Drp1 and pDrp1S616 protein levels. *P<0.05 in Student's t-test comparison, n=3. (d) Mitochondrial morphology of cultured cortical neurons on DIV4 (left panel) or DIV10 (right panel). Mitochondria were visualized by cotransfection of a DsRed-mito plasmid (red). Large magnification images of the mitochondrial morphology in white dotted boxes are straightened by using the ‘straighten' module of ImageJ and are shown at the bottom of each panel. (e) Frequency-fractionation analysis of mitochondrial length. (f) Average of mitochondrial length. *P<0.05 in Student's t-test comparison, n=10.

