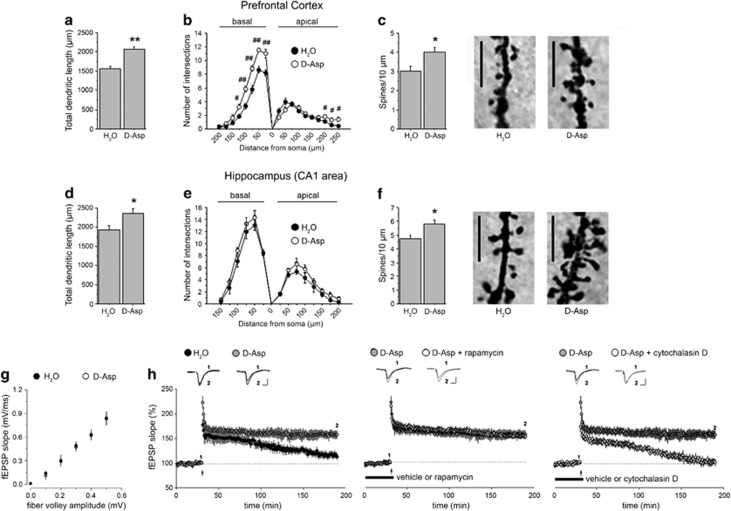
Figure 2.
Dendritic morphology and late-phase LTP in mice treated with D-aspartate (D-Asp). Analysis of dendritic morphology was performed on C57BL/6J mice drinking D-Asp or H2O in pyramidal neurons of the (a–c) PFC (n=5 mice per treatment, 5 neurons per mouse) and (d–f) CA1 subfield of the hippocampus (n=5 mice per treatment, 4 neurons per mouse) after Golgi-Cox staining. (a and d) Total dendritic length (in μm) measured in the (a) PFC and (d) CA1 subfield of the hippocampus. (b and e) Number of intersections between basal or apical dendrites and Sholl concentric circle lines at different distances from soma center in both (b) PFC and (e) CA1 area. Concentric circles increase in diameter by 25 μm increments. (c and f) Spine density (number of spines per 10 μm) evaluated in (c) the PFC and (f) CA1 area of mice. The right panels show representative dendrites. **P<0.01, *P<0.05, compared with untreated mice (Student's t-test). ##P<0.01, #P<0.05, compared with untreated mice (Fisher's post hoc). Scale bar, 5 μm. (g) Input–output relation of field excitatory postsynaptic potentials (fEPSPs) as a function of presynaptic fiber volley size shows similar fEPSPs slopes over a range of stimulus intensities for both untreated C57BL/6J (n=6) and D-Asp-treated C57BL/6J (n=6) mice. Data are expressed as mean±s.e.m. (P>0.05, Student's t-test). (h) Time plot of hippocampal fEPSP responses showing the effect of E-LTP stimulation paradigm in untreated C57BL/6J mice and D-Asp-treated C57BL/6J mice (n=6 mice per treatment; left panel). Hippocampal L-LTP in D-Asp-treated mice was unaffected following bath-application of 20 nM rapamycin (transiently bath-applied for 40 min; n=6 vehicle-treated slices, n=5 rapamycin-treated slices; middle graph) but was fully blocked following bath-application of 100 nM cytochalasin D (continuously bath-applied; n=6 vehicle-treated slices, n=5 cytochalasin D-treated slices; right panel). Insets show field EPSPs from representative experiments during baseline and following LTP induction (1 s, 100 Hz tetanus). Vertical bar, 0.5 mV; horizontal bar, 10 ms. LTP, long-term potentiation; PFC, prefrontal cortex.

