
Figure 1.
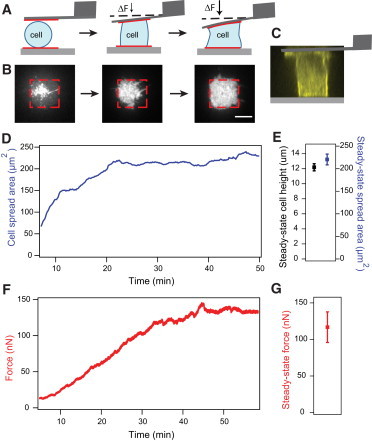
Single cells spread between two surfaces reach a steady-state height, spread area, and tension. (A) Schematic diagram of the contraction-force microscopy setup. Cartoon depicts a cell undergoing morphological changes as it spreads between an AFM cantilever and a glass substrate. The two surfaces are patterned with fibronectin to constrain cell adhesion and spreading. The cell spreads and contracts against the cantilever, which enables nanoNewton-level measurements of traction force in the vertical direction. The cell eventually fills up the micropatterned substrates to form an hourglass shape. Note that the deflection of the cantilever is exaggerated to illustrate changes in force measurements. (B) TIRF images of the spreading process on the bottom surface. The cell was visualized using a membrane dye (scale bar: 10 μm). (C) A side projection of an NIH3T3 fibroblast expressing mCherry-LifeAct at steady state taken with confocal microscopy showing a columnar shape and cortical actin underneath the membrane. (D) Example trace of cell spread area increasing over time and eventually reaching a steady state when the cell has filled up the patterned area. (E) Average height (N = 39) and spread area (N = 19) during steady state. Error bars indicate standard error. (F) Example trace of cell tension also increasing during spreading and reaching a plateau when spreading ceased. Note: Area and force traces from panels E and F are taken from different cells. (G) Average steady-state force (N = 42). Error bars indicate standard error. To see this figure in color, go online.