
Figure 4.
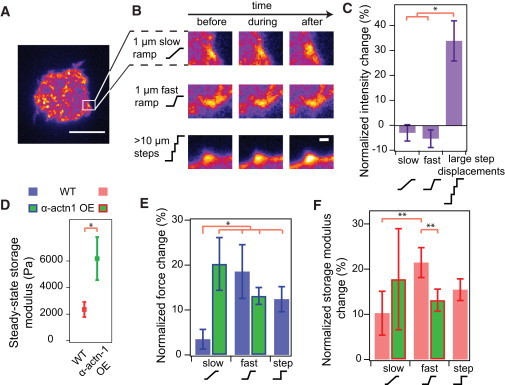
Rate-dependent changes in steady-state tension are dependent on cytoskeletal crosslinking but do not involve changes in adhesions. (A) A pseudo-colored image of vinculin after a cell has reached steady-state spread area (scale bar: 10 μm). (Open square) Size of the subset region. (B) Vinculin intensity was tracked before, during, and after ramp displacements in height. Images show the intensity of a subset region of different cells over time subjected to a slow ramp, fast ramp, or a large step strain (see panel A for subset area depiction). Vinculin intensity change was observed only after a large strain (consisting of multiple step displacements) was applied (scale bar: 1 μm). (C) The average intensity of adhesions remained unchanged after slow and fast ramp displacements. However, significant reinforcement was observed when a very large strain was applied to the cell. Error bars represent standard error (Nslow = 2, Nfast = 4, Nstep = 3; ∗p < 0.05). (D) Cells overexpressing α-actinin-1 were significantly stiffer than normal cells (Nwt = 18, Nactn = 9; ∗p < 0.05). (E) Cells overexpressing α-actinin 1 showed a large normalized force change when they were displaced by 1 μm at a slow (0.1 μm/min) and fast (1 μm/min) rate. The contractile responses of wild-type cells after slow, fast, and step strains were presented again for easier comparison. Error bars represent standard error (Nslow = 6, Nfast = 6; ∗p < 0.05). (F) Normalized changes in storage modulus of cells overexpressing α-actinin-1 after slow and fast ramp displacements. The normalized changes in storage modulus of wild-type cells after slow, fast, and step strains were presented again for easier comparison. No significant difference in storage modulus change was observed for the two loading rate conditions. Error bars represent standard error (Nslow = 6, Nfast = 6; ∗∗p < 0.1). To see this figure in color, go online.