
Figure 2.
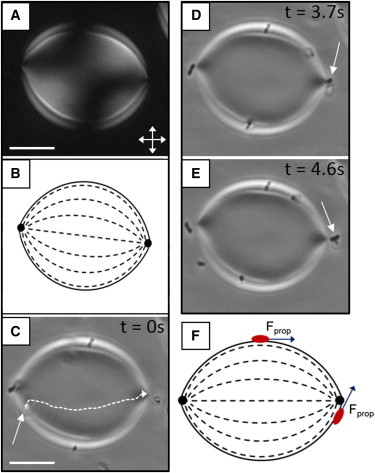
Guided motility and escape of a cell adsorbed to a nematic tactoid. (A) Optical micrograph (crossed polars) of a nematic tactoid that formed within a continuous isotropic phase upon quenching a 15 wt % DSCG sample from 40°C to 33°C and that partially wets one of the glass surfaces of the imaging chamber. (B) Schematic representation of the LC director profile of the tactoid in A. (C) Bright field micrograph of a nematic tactoid on which the trajectory of a motile P. mirabilis cell (depicted by an arrow) adsorbed to the N-I interface is indicated. (D and E) Bright field micrographs of a motile cell that escapes from the N-I interface at a boojum (topological defect at the cusped pole) of the tactoid. In D, the cell is oriented toward the viewer. (F) Schematic diagram depicting the orientation of the flagella-derived propulsive force (Fprop) of motile bacteria adsorbed at various positions on the interface of a nematic tactoid. Scale bars are 10 μm. To see this figure in color, go online.