
Figure 1.
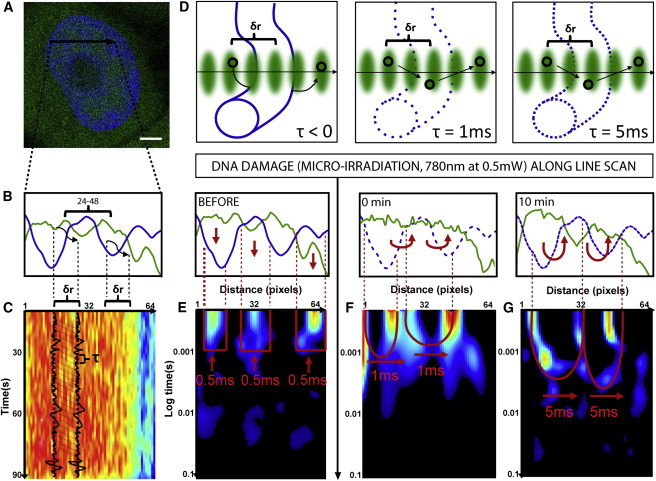
Changes in chromatin compaction during the DNA damage response measured by pair correlation analysis of EGFP molecular flow. (A) HeLa cell expressing EGFP with the chromatin marked by Hoechst 33342, scale bar equals 3 μm. The line scan selected for pair correlation analysis of EGFP molecular flow with respect to chromatin superimposed. (B) Intensity profile of free EGFP (green) and DNA (blue) along the selected line scan shows a high-density chromatin region between pixels 24 and 48 that slightly excludes EGFP from this environment. (C) Intensity carpet of free EGFP along the selected line scan (1 × 10⁵ lines). Each column of the intensity carpet thus contains an intensity fluctuation and pair correlation analysis can be performed between columns of the intensity carpet at a distance (δr) that cross-correlates intensity fluctuations located outside the high-density chromatin region to intensity fluctuations located inside the high-density region. The time delay (τ) at which maximum cross-correlation is observed between two columns indicates the average time taken by the molecules to enter the chromatin region. (D) In the instance a chromatin region is inaccessible, this will cause molecules to diffuse around the fiber and τ < 0. Alternatively, if a chromatin region is accessible and therefore allows molecules to diffuse through it, depending on its compaction status this will cause τ > 0. (E) Pair correlation analysis of intact chromatin at a distance of 5 pixels (pCF(5)) reveals disconnect molecular flow (as indicated by vertical red arrows) inside and outside of the chromatin (blue line). (F) Pair correlation analysis of chromatin 0 min after damage at pCF(5) reveals moderately delayed molecular flow in and out of the chromatin on a timescale of 1 ms (as indicated by the double-arc feature and horizontal red arrows). (G) Pair correlation analysis of chromatin 10 min after damage at pCF(5) reveals significantly delayed molecular flow in and out of the chromatin on a timescale of 5 ms. To see this figure in color, go online.