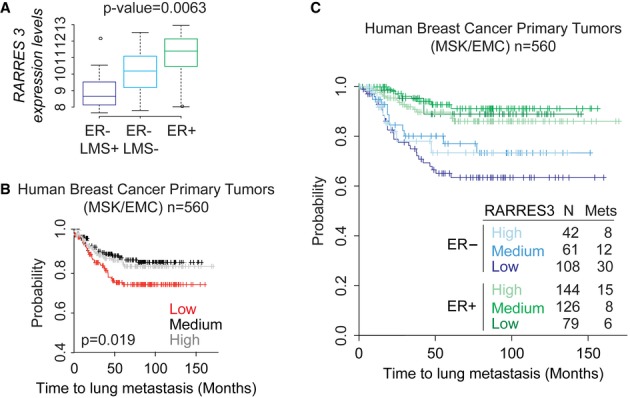
Figure 1. RARRES3 suppression in breast tumors.

- Box plot of RARRES3 expression levels in the MSKCC (n = 82) breast cancer tumor dataset according to ER and lung metastasis signature (LMS) status.
- Kaplan–Meier representation of the probability of lung metastasis-free survival in the MSK/EMC breast cancer tumor dataset (n = 560) according to RARRES3 levels of expression. Low, medium, and high represent RARRES3 expression levels in the following way: low (< mean ± SD), medium (≥ mean ± SD and ≤ mean ± SD), and high (> mean ± SD).
- Kaplan–Meier representation of the probability of lung metastasis-free survival in 560 breast cancer cases according to the ER status and RARRES 3 expression levels according to (B).
