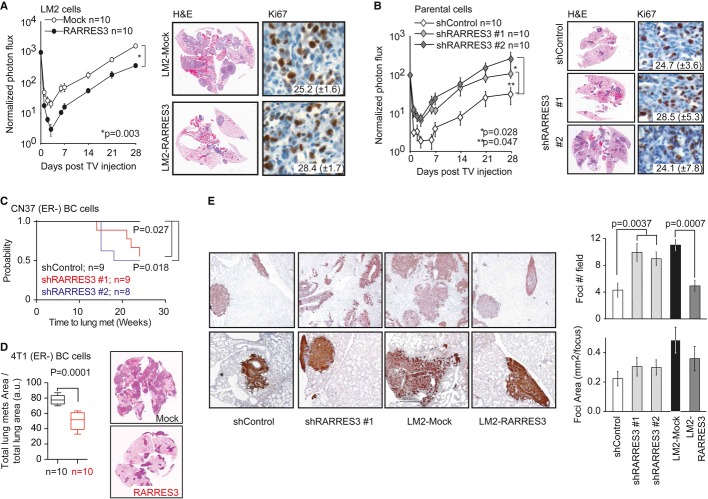
Figure 3. RARRES3 depletion facilitates lung colonization.
- LM2-Mock and LM2-RARRES3 cells (2 × 10⁵) were injected into the tail vein of mice. Lung colonization was assayed by weekly bioluminescence imaging. Plots show normalized photon flux in the lung over time (n = 10 per group). Representative H&E and Ki-67 staining of lung sections 4 weeks after engrafting are shown. Data are averages ± SEM.
- Parental MDA-MB-231 cells (2 × 10⁵) transduced with a control vector (shControl) or two independent RARRES3 shRNA vectors (shRARRES3 #1 and #2) were injected into the tail vein of mice. Lung colonization was assayed by weekly bioluminescence imaging. Plots show normalized photon flux in the lung over time (n = 10 per group). Representative H&E and Ki-67 staining of lung sections 4 weeks after xenografting are shown. Data are averages ± SEM.
- CN37 patient-derived metastatic breast cancer cells (2 × 10⁵) transduced with a control vector (shControl) or two independent RARRES3 shRNA vectors (shRARRES3 #1 and #2) were injected into the tail vein of mice (n = 8, 9 and 9 per group, respectively). Lung colonization was assayed by weekly bioluminescence imaging. Kaplan–Meier curve of the probability of lung metastasis-free survival for CN37 shControl, shRARRES3#1, and #2 is presented. Log-rank test was used to establish statistical significance.
- 4T1 mouse-derived breast cancer cells (2 × 10⁵) transduced with a Mock or RARRES3 vector were injected into the tail vein of mice (n = 10 per group). Lung colonization was assayed by calculating the total area of lung metastasis lesion normalized per the total area of the lungs (H&E). Three sections were analyzed per lung. Data are averages of 10 lungs (mice) per group ± SEM. Wilcoxon test was used to establish statistical significance. Representative H&E sections are shown.
- Vimentin IHC of lung sections from animals inoculated with the indicated lines. Upper panels: 2× magnification. Lower panels: 4× magnification. Quantification of the number of foci per field and of the average area per foci is shown in the right panels. Data are averages ± SEM.

