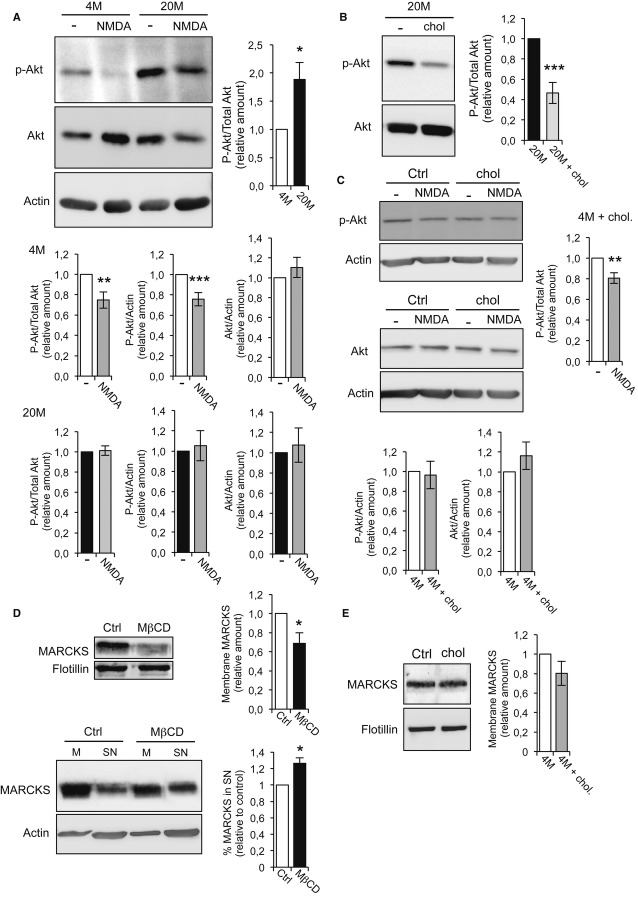
p-Akt levels in acute hippocampal slices prepared from young (4M) and old (20M) mice in control conditions or 1 h after NMDA-LTD induction were assessed in Western blots. The quantification shows that in control conditions, the levels of p-Akt are 50% higher in 20M than in 4M mice. Stimulation with 20 μM NMDA induced p-Akt dephosphorylation in 4M but not in 20M mice. The bar plots show the levels of p-Akt in young and old mice, corrected for total Akt and for β-actin, in controls and after stimulation. The quantification of total Akt/β-actin shows that the total Akt levels do not change after stimulation. The levels of p-Akt/Akt after stimulation were: 4M = 0.75 ± 0.081 (n = 5 animals, P = 0.014), and 20M = 1.01 ± 0.047, (n = 5 animals, P = 0.767). The levels of p-Akt/β-actin after stimulation were: 4M = 0.76 ± 0.065, (n = 5 animals, P = 0.004), and 20M = 1.05 ± 0.15, (n = 8 animals, P = 0.726). The levels of total Akt/β-actin after stimulation were: 4M = 1.10 ± 0.101 (n = 5 animals, P = 0.340) and 20M = 1.08 ± 0.170, (n = 8 animals, P = 0.664).
Western blot and quantification showing that addition of cholesterol to acute slices from 20M mice restores the basal levels of p-Akt observed in young mice [20M + chol = 0.47 ± 10.3 (n = 5 animals, P = 0.0008)].
Control experiments show that the addition of cholesterol to acute hippocampal slices from 4M mice does not effect on the levels of p-Akt and total Akt, or on p-Akt dephosphorylation after 20 μM NMDA stimulation. p-Akt/β-actin: 4M + chol = 0.96 ± 0.139 (n = 5 animals, P = 0.805); Akt/β-actin: 4M + chol = 1.16 ± 0.138 (n = 5 animals, P = 0.311). The levels of p-Akt/Akt after stimulation were: 4M + chol = 0.81 ± 0.051 (n = 5 animals, P = 0.0143).
Lower levels of the PIP2-binding protein MARCKS were found in membrane preparations from 15 DIV cholesterol-depleted neurons compared to controls. The plot shows the amount of MARCKS attached to the membrane relative to controls: control neurons = 1.00; MβCD-treated neurons = 0.688 ± 0.11 (P = 0.045, n = 5 different cultures). The Western blots below show the membrane-supernatant distribution of MARCKS in control neurons or after cholesterol depletion by MβCD. As can be seen in the blots, MβCD provokes a reduction in the MARCKS present in the membrane fraction (M) with a concomitant 26.33 ± 6.4% increase in the supernatant (SN, P = 0.02, n = 3 different cultures).
The Western blot corresponds to control experiments showing that the addition of cholesterol to hippocampal slices from 4M mice does not affect the amount of MARCKS found in membrane fractions: 4M + chol = 0.80 ± 0.124 (P = 0.187, n = 3 animals).
Data information: In (A-E), the presented values are relative to controls, considered as 1. The
-test. Source data are available for this figure.

