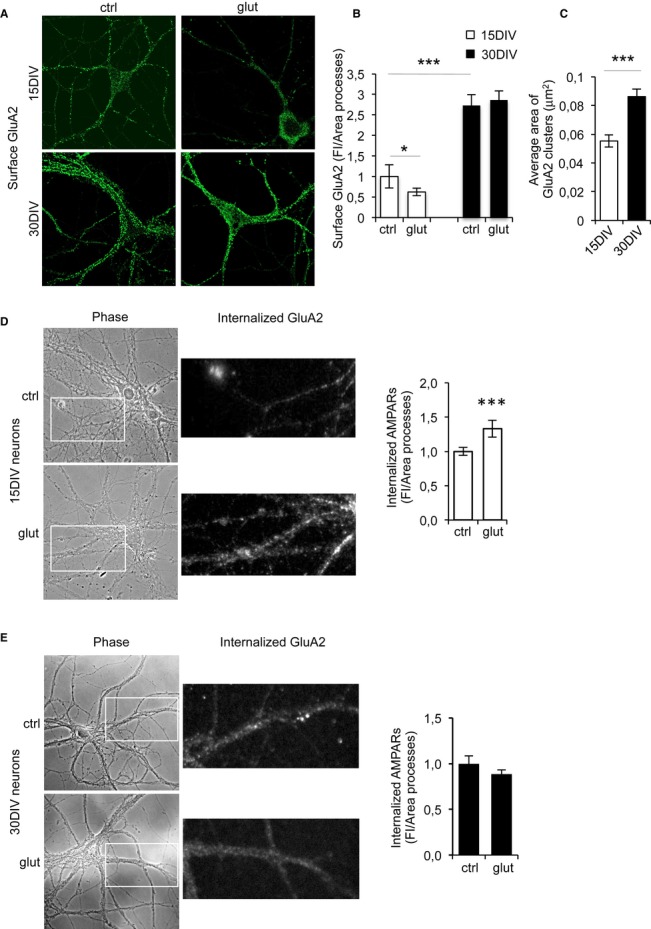
Figure 3. Surface GluA2-AMPARs accumulate in low-cholesterol hippocampal neurons.

- A, B The surface staining of GluA2-containing AMPARs (A) is significantly higher in 30 DIV than in 15 DIV neurons (15 DIV = 1.00 ± 0.28; 30 DIV = 2.73 ± 0.27; P < 0.0001, n = 3). Stimulation with glutamate (100 μM) resulted in decreased GluA2 staining of 15 DIV (15 DIV glut = 0.62 ± 0.095; Pcontrol, glut = 0.0310; n = 3) but not 30 DIV neurons (30 DIV glut = 2.86 ± 0.219; Pcontrol, glut = 0.053; n = 3), indicating that low-cholesterol neurons have a reduced capability to endocytose AMPARs in response to ligand. Fluorescence intensity (FI/area) quantified in the processes of neurons is shown in (B).
- C Quantification of the area of GluA2-AMPARs clusters in 15 and 30 DIV neurons indicates that larger receptor clusters form in low-cholesterol neurons (average area 15DIV: 0.055 ± 0.0042 μm2, 30 DIV: 0.086 ± 0.0053 μm2, P = 0.0009, n = 3 different cultures).
- D, E Fluorescence images show the internalized AMPARs in 15DIV and 30DIV neurons, before and after glutamate stimulation. The fluorescence images correspond to higher magnifications of the regions indicated in the insets. Glutamate exposure resulted in increased AMPAR internalization in 15 DIV neurons (D) and 5 min after glutamate addition the fluorescence intensity (FI)/area measured in the processes increased from 1 ± 0.06 to 1.33 ± 0.12 (t-test, P = 0.0082, n = 4). Glutamate addition did not increase AMPAR internalization in 30 DIV neurons (E). The values of FI/area in the processes were 1 ± 0.082 and 0.88 ± 0.048 (t-test, P = 0.252, n = 3).
