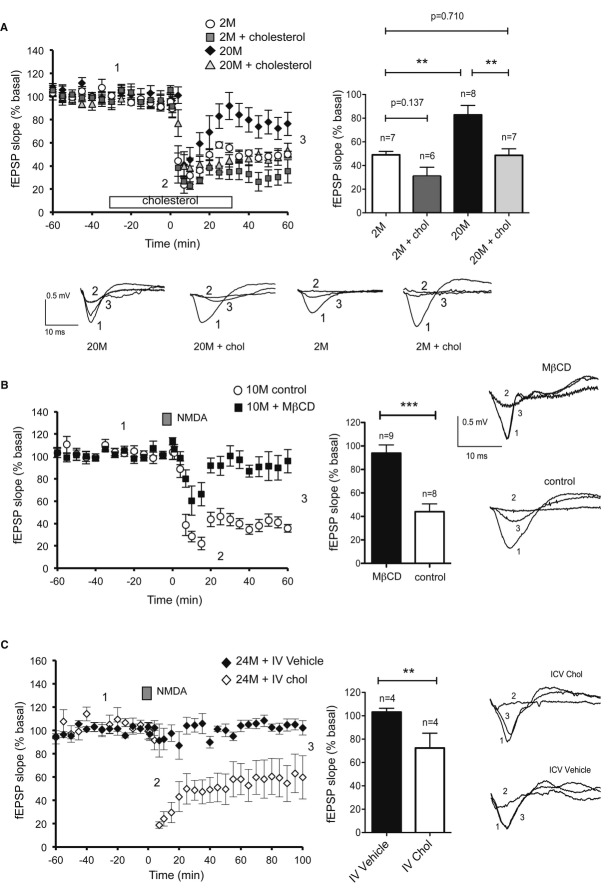
NMDA-LTD was observed in slices of 2-month-old mice (2M, ○), but it was absent in 20-month-old mice (20M, ♦), yet cholesterol replenishment restored LTD in old slices (20M + chol, ▵ gray filled). Cholesterol perfusion did not have any effect on 2M slices (2M + chol, □ gray filled). Empty boxes indicate the period of cholesterol perfusion. Gray squares represent the time of NMDA application. The plot shows the average ± s.e.m. of the responses collected from the last 20 min of the recordings. Values, 2M: 49.05 ± 2.94%; 2M + chol: 30.82 ± 7.68% (P2M, 2M+chol = 0.137); 20M: 82.69 ± 8.02%; 20M + chol: 48.61 ± 5.50% (P2M, 20M = 0.014; P20M, 20M+chol = 0.0093).
Cholesterol depletion impaired NMDA-LTD in middle-aged hippocampal slices. Treatment with MβCD 2 h prior to NMDA addition abolished NMDA-LTD in 10-month-old mice. Control (○), cholesterol depleted (▪). The average ± s.e.m. of the responses collected from the last 20 min of the recordings for the control (38.43 ± 3.68%) and MβCD-treated groups (90.82 ± 8.45%; P = 0.0003) are plotted on the right.
Intraventricular infusion of cholesterol in old mice restored NMDA-LTD. Field excitatory postsynaptic potentials (fEPSPs) were recorded from hippocampal slices of 24-month-old mice infused with cholesterol (♢) or vehicle (♦) in the lateral ventricle for 14 days. A significant NMDA-LTD was obtained in slices prepared from cholesterol-infused mice, but no LTD was observed in the vehicle-treated group. The plot shows the average ± s.e.m. of the responses collected from the last 20 min of the recordings for control (IV vehicle: 104.02 ± 3.64%) and cholesterol-treated group (IV chol: 68.05 ± 17.34%; P = 0.0286).
Data information: The sample traces recorded at the times indicated as 1, 2, and 3 for each condition are shown in (A), (B), and (C). In all the cases, the data were compared using Mann-Whitney non-parametric
t-tests and the number of animals (
n) is shown in the figure.

