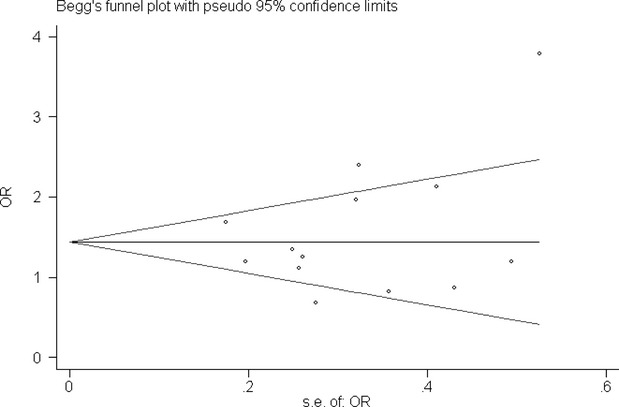
Fig. 6.

Begg*s funnel plot for studies of the association of T1DM associated with TAP1 I333V gene polymorphism under an additive genetic model (V versus I). The horizontal and vertical axis correspond to the OR and confidence limits. OR: odds ratio; SE: standard error.
