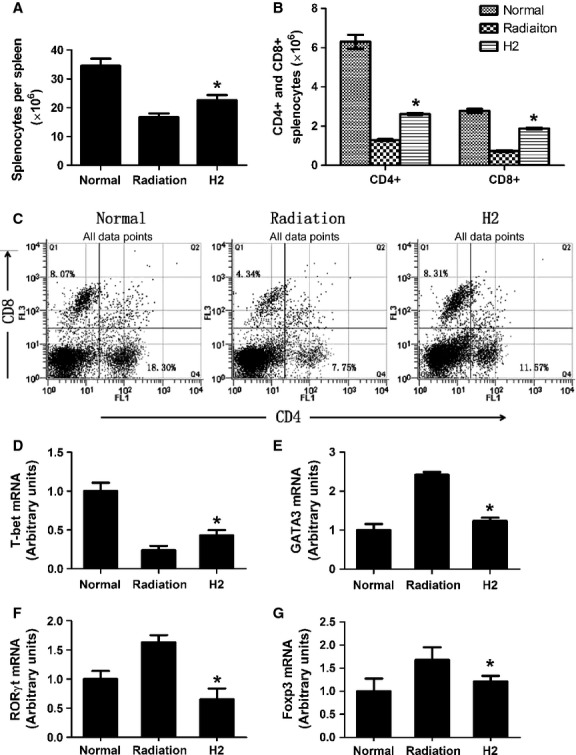
Fig. 5.

Effects of hydrogen on radiation-induced disorder in T cell. (A) The total number of splenocytes in normal, radiation, H2-pre-treated mice 14 days after exposure. (B and C) The absolute number and percentage of CD4 + and CD8 + T cells in normal, radiation, H2-pre-treated mice 14 days after exposure. (D–G) T-bet, GATA-3, Foxp-3, RORγt mRNA expression was detected by real-time PCR and normalized to GAPDH. The data were expressed as means ± SEM (n = 8), *P < 0.05.
