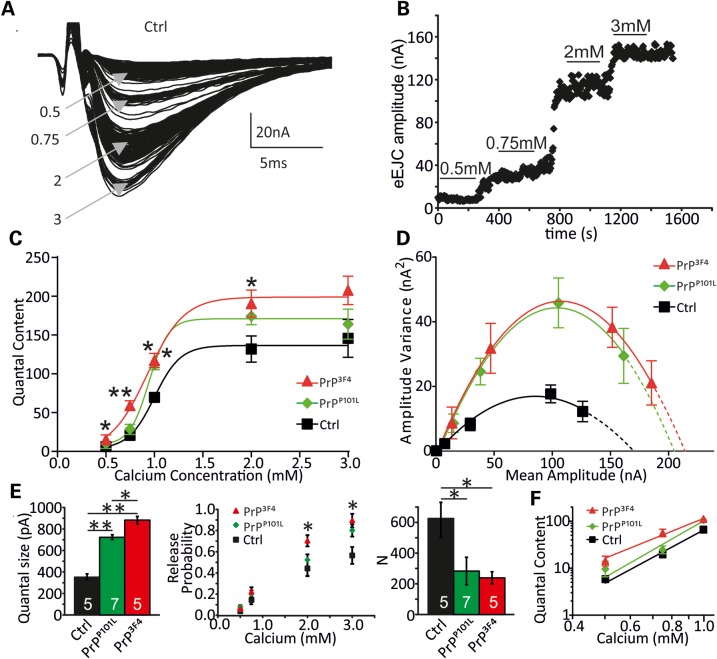
Figure 6.
Prion expression induced changes in synaptic release parameters. (A) Group of eEJCs recorded from one NMJ at different indicated [Ca2+]e in mm. (B) eEJC amplitudes of a PrP3F4 expressing NMJ elicited at 0.2 Hz at different [Ca2+]e. The lines indicate regions used for analysis. (C) Mean QC plotted versus different [Ca2+]e for the genotypes indicated and fitted with a Hill function according to QC([Ca2+]) = QCmax[1+(EC50/[Ca2+])slope]−1 which yielded QCmax = 136 ± 6, 171 ± 5 and 194 ± 15; EC50 = 1.0 ± 0.02 mm, 0.9 ± 0.01 mm and 0.9 ± 0.06 mm and Hill slope = 3.3 ± 0.5, 4.3 ± 0.3 and 2.4 ± 0.3 for Ctrl, PrPP101L and PrPC NMJs, respectively (Hill slope: PrP3F4 versus Ctrl: *P < 0.05, PrP3F4 versus PrPP101L: ***P < 0.001, data denote mean ± SD, ANOVA with Tukey–Kramer post hoc test, n = 8–11 NMJs [n = 5 animals for control, n = 6 animals for PrPP101L, n = 5 animals for PrP3F4]). Note, PrP3F4 causes a left-shifted [Ca2+]e—QC relationship but also and change in the slope of the fitted curves. (D) Parabolic fits to the variance–mean relationships for the three genotypes indicated. Note data are from a different subset of experiments as in C (data denote mean ± SEM). (E) Mean quantal parameters quantal size q, vesicular release probabilities (pvr) at different [Ca2+]e and number of release-ready vesicles (N) estimated from fluctuation analysis in all three genotypes (*P < 0.05, **P < 0.01, ANOVA with Tukey–Kramer post hoc test, with n—number of NMJs indicated in bars [n = 4 animals for control, n = 4 animals for PrPP101L, n = 4 animals for PrP3F4], data denote mean ± SEM). (F) Double-logarithmic plot of the QC as a function of [Ca2+]e for all three genotypes as indicated. Ca2+ dependency is decreased in PrP3F4 but not PrPP101L: controls (3.7 ± 0.4), PrPC (2.7 ± 0.3*, P = 0.036), PrPP101L (4.0 ± 0.9, P = 0.23), n = 20–27 NMJs [n = 12 animals for control, n = 11 animals for PrPP101L, n = 14 animals for PrPC]. Data denote mean ± SD, Student's t-test, ANOVA did not reveal any significance.

