Figure 1.
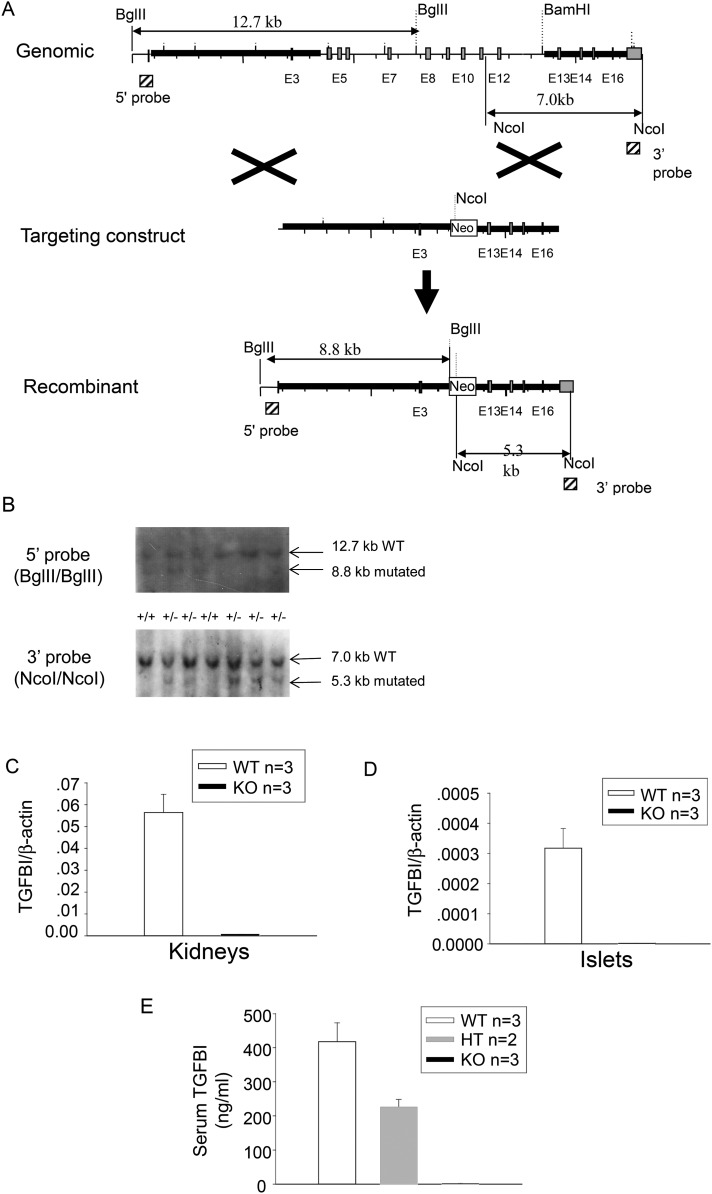
Generation of TGFBI KO mice. (A) Targeting strategy generating TGFBI KO mice. The light gray vertical bars are exons. The hatched squares on 5′ and 3′ sides of the mouse TGFBI WT genome represent the sequences serving as probes for genotyping by Southern blotting. The sizes of WT and mutated alleles cut by BglII and NcoI are indicated. (B) Genotyping of TGFBI mutant mice. Tail DNA was digested with BglII or NcoI, and analyzed by Southern blotting, with the 5′ and 3′ probes, respectively. The locations of the probes are indicated in (A). A 7.0-kb band representing the WT allele and a 5.3-kb band representing the recombinant allele are indicated by arrows. (C and D) Absence of mRNA expression in TGFBI KO tissues. mRNA levels from WT and KO kidneys (C) and islets (D) were analyzed by RT–qPCR for TGFBI mRNA expression. The results are expressed as ratios of TGFBI versus β-actin signals with means ± SD from three pairs of KO and WT mice. (E) Absence of TGFBI protein in sera of Tgfbi KO mice. Sera from WT, heterozygous and KO mice were assayed by TGFBI ELISA. Samples were assessed in duplicate by ELISA and mouse numbers were indicated. Means ± SD for each group are reported.

