
Figure 2.
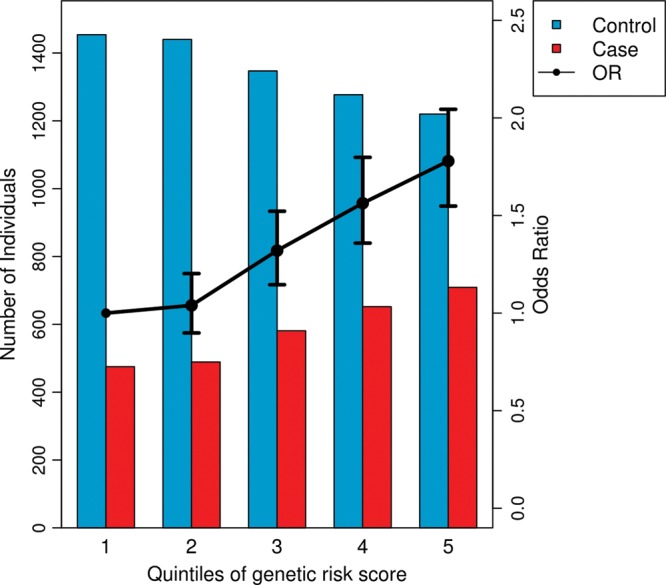
CAD genetic risk score categories and risk for MI based on previously identified CAD SNPs. This figure shows an increased risk of MI (OR >1) for individuals with higher weighted genetic risk scores based on 48 CAD GWAS variants. The black line shows ORs and 95% CIs for association with MI for individuals grouped into risk score quintiles compared with the first quintile (labels on right vertical axis). Compared with the first quintile, the second to fifth quintiles have ORs 1.04, 1.32, 1.56 and 1.78, respectively, and 95% CIs [0.90, 1.20], [1.15, 1.52], [1.36, 1.80] and [1.55, 2.04], respectively. The risk scores were calculated for individuals in the Stage 1 sample (N = 9644) for 45 previously identified CAD variants that were directly typed on the exome array and three proxy markers in high linkage disequilibrium (LD) with the previously identified CAD variants (1,3,4). By testing all individuals in a regression framework, the genetic risk score was strongly associated with MI (P = 1 × 10⁻²⁸). Alleles were weighted by their published effect sizes. The bars represent the number of MI cases (red bars) and controls (blue bars) in each risk score quintile (labels on left vertical axis).