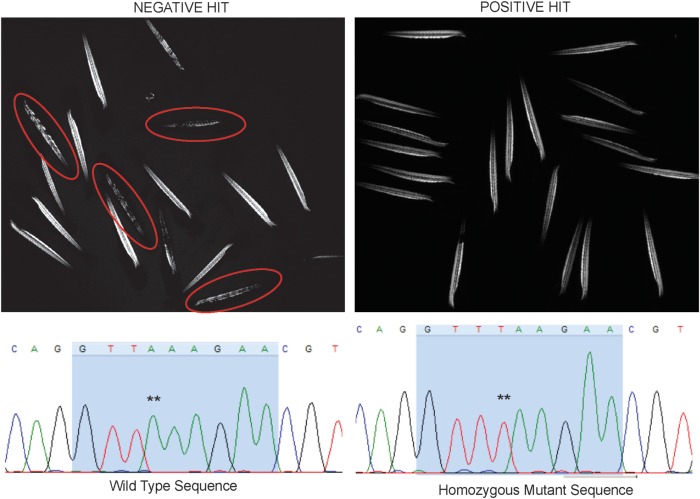
Figure 2.
Representative images of positive and negative ‘hits’. (Left panel) Example of a negative hit. Depicted is the birefringence pattern from a pool of 20 zebrafish treated with drug. Embryos with abnormal birefringence are circled in red. (Right panel) Example of a positive hit. Depicted is the birefringence pattern of a pool of zebrafish treated with a drug that prevented the development of abnormal birefringence. Note that all of the zebrafish look identical, despite the fact that ∼25% (i.e. 5/20) should be sapje and thus have abnormal birefringence. (Bottom panels) Sequencing chromatograms from DNA extracted from the two embryos from a positive hit pool (treated with fluoxetine). DNA was isolated from each embryo from B and subjected to PCR based Sanger sequencing. The chromatogram on the left depicts wild-type sequence, and the chromatogram on the right depicts sequence from an embryo with normal birefringence but the sapje genotype (** marks the homozygous nonsense mutation A>T).

