Figure 8.
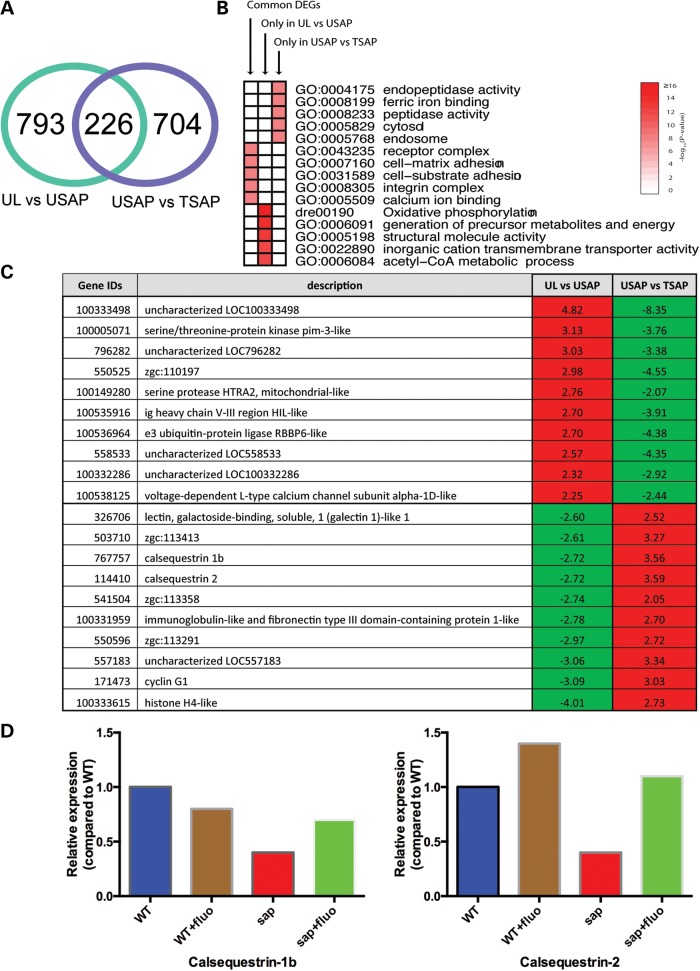
Microarray analysis of fluoxetine-treated sapje zebrafish. Comparative microarray analysis was performed on untreated and fluoxetine-treated embryos using the Affymetrix Zebrafish Gene 1.1 array platform. (A) Venn diagram of DEGs. There were 1019 DEGs between untreated wild-type and sapje embryos. Two hundred and twenty-six of these were reversed with fluoxetine treatment. An additional 704 DEGs were uncovered between untreated and treated sapje. (B) Heat map showing the most significantly over-represented biological functions in the differentially expressed transcripts. (C) Examination of the most significantly changed transcripts revealed enrichment for gene products associated with calcium homeostasis. (D) Quantitative RT-PCR was performed to validate several of the transcriptional changes observed by microarray analysis. Depicted graphically are the results for calsequestrin 1b and calsequestrin 2. Specific fold changes were as follows (with untreated wild-type set nominally as 1.0): calsequestrin 1b = 0.8-fold (wild-type treated with fluoxetine), 0.4-fold (untreated sapje), and 0.7-fold (treated sapje); calsequestrin-2 = 1.4-fold (WT plus fluoxetine), 0.4-fold (untreated sapje) and 1.1-fold (sapje plus fluoxetine).

