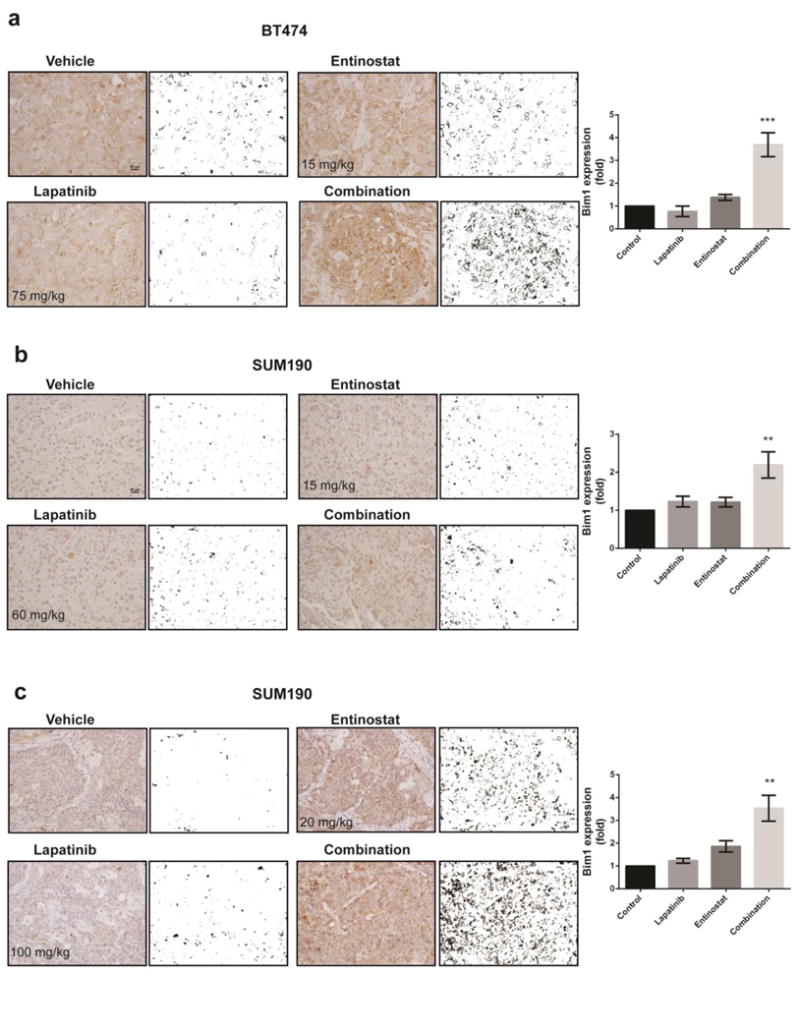
Fig. 6.

Immunohistochemical staining and quantification of Bim1 expression in representative tumor samples from each treatment group. a BT474. b SUM190 with low-dose treatment. c SUM190 with high-dose treatment. The images were converted by ImageJ software to accomplish quantification of Bim1 expression. Data shown are representative of 3 IHC staining experiments with similar results. Magnification, ×20; scale bar, 50 μm. Bars in graph represent means; error bars, standard deviation. ** p <0.01, *** p <0.001 compared combination with either control or single treatment.
