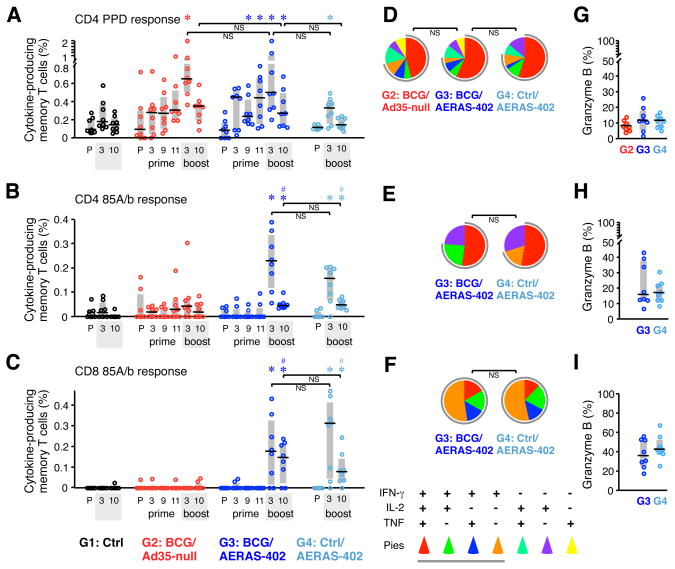
FIGURE 2. Pre-challenge cellular immune responses in PBMC.
(A–C) The frequency of memory CD4 (A, B) and CD8 (C) T cells in PBMC producing IFN-γ, IL-2, or TNF in response to PPD (A) or Ag85A/b peptides (B, C) was measured by flow cytometry at a pre-immune (P) time point, 3, 9, and 11 wks after the BCG prime (G2 and G3), and 3 and 10 wks after the Ad35-null or AERAS-402 boost (G2–G4). Interquartile range (shaded box) and median (black line) of individual responses are indicated. (D–F) The quality of the T cell responses in panels A–C, respectively, 10 wks post-boost. Pie charts show the fraction of total cytokine-response comprising any combination of IFN-γ, IL-2, or TNF (gray pie arcs show the proportion of IFN-γ-producing cells). Pies (average of n = 8) are shown for groups with measurable responses. (G–I) The percent of cytokine-producing T cells in panels A–C, respectively, producing granzyme B 10 wks post-boost. *p ≤ 0.05 compared to pre-immune within same group; #p ≤ 0.05 compared to Ctrl at 10 wks post-boost; NS: not significant.

