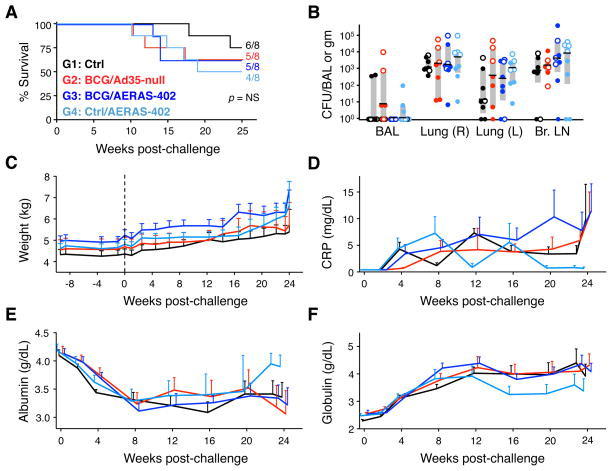
FIGURE 4. Survival, bacterial burdens, and clinical data.
(A) Survival curves following M.tb challenge. Shown are the fraction and percentage of animals that survived until the fixed study endpoint for each vaccine group (B) M.tb CFU per total BAL volume harvested or per gram of tissue for the right (R) and left (L) lung lobes and bronchial (Br.) lymph nodes for each animal at time of necropsy. Interquartile range (shaded box) and median (black bar) are indicated for each group. Open symbols indicate rapid progressors. (C) Average weight (with SEM) for each vaccine group at the indicated week relative to challenge (dashed line). Individual animal weights are shown in Supp. Fig. 3. Average serum levels of C-reactive protein (CRP; D), albumin (E) and globulin (F) for each group with SEM at the indicated wks post-challenge. Values were calculated using available data from 4–8 animals per group per time point.

