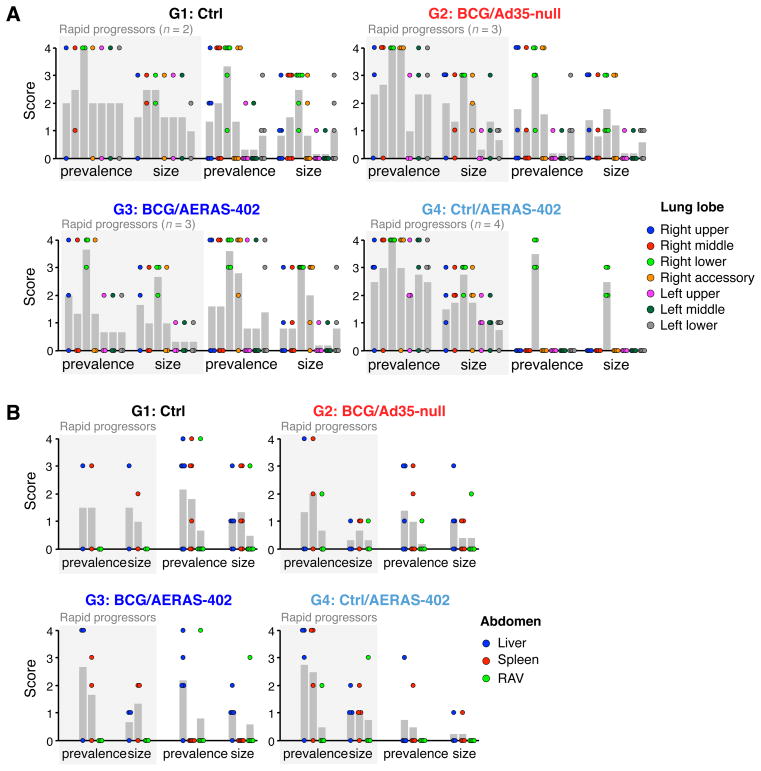
FIGURE 5. Gross pathology observations.
Granuloma severity in the lung (A) and abdominal viscera (B). The prevalence and size of granulomas were scored on a scale ranging from 0 to 4 (with increasing severity) in each lung lobe (A; right lower lobe is site of challenge) as well as in the liver, spleen, and remaining abdominal viscera (RAV; B) in each animal at the time of necropsy. Each vaccine group is shown on a separate graph with data segregated by whether the animal was a rapid progressor (shaded area) or survivor (unshaded area). Gray bars indicate the mean score.

