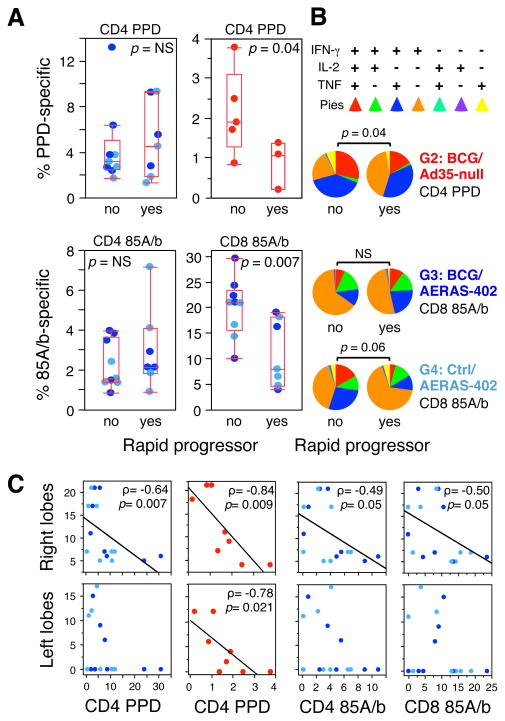
FIGURE 6. Correlation of pre-challenge immune responses with protection against M.tb.
(A) CD4 and CD8 T cell cytokine responses (IFN-γ, IL-2 or TNF) against PPD or Ag85A/b peptides in the BAL are compared between survivors (no) and rapid progressors (yes) in AERAS-402- (light/dark blue symbols; 10 wks post-boost) or BCG/Ad35-null- (red symbols; peak response) immunized groups. (B) Comparison of the T cell cytokine expression profiles in survivors and rapid progressors for peak PPD-specific CD4 responses (G2) and Ag85A/b-specific CD8 responses (G3, G4). Significant p values (t-test) are indicated; NS: not significant. (C) Spearman correlation between BAL T cell responses in AERAS-402- or BCG/Ad35-null- immunized animals 3 wks post-boost and lung granuloma severity at necropsy. Granuloma prevalence and size scores were summed for either the right or left lung lobes. Spearman’s rho (ρ) and p values are indicated for significant correlations; linear regression fit is shown for illustration.

